The selfiecity team is back! In a new project with Lev Manovich, Moritz Stefaner and Daniel Goddemeyer, we tackled the representation of city life in the 21st century. Reminiscent of pieces like Ed Ruscha's "Every Building on the Sunset Strip", On Broadway shows the iconic street in New York City as recreated from the data streams of thousands of people.
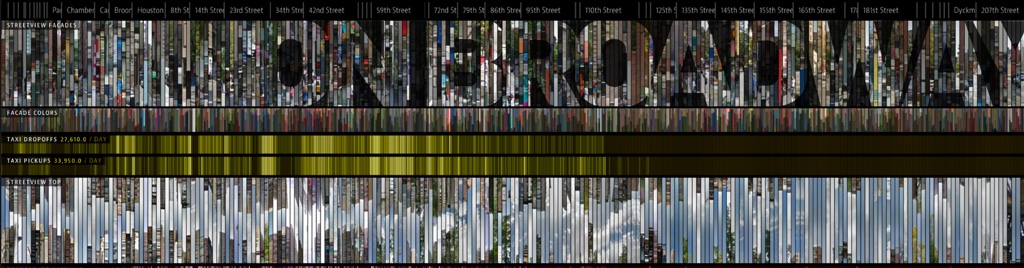
*On Broadway* shows New York City's iconic street through the lens of data.
On Broadway contains data from various sources, the usual suspects such as Twitter, Instagram and Foursquare, but also Google's streetview images (close to Ruscha's ideas), census data to highlight differences in income and Taxi trips.
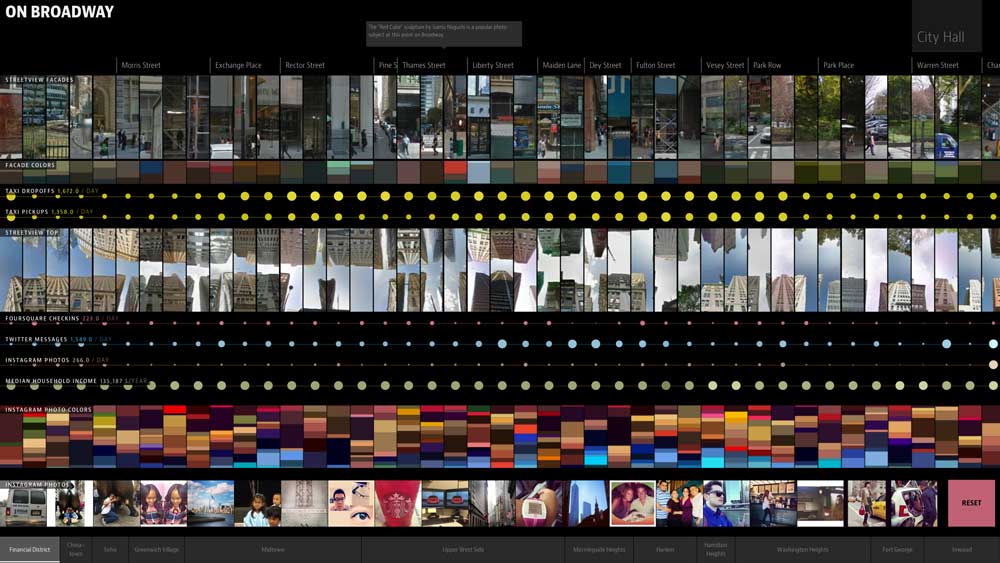
Zooming in lets you browse along the street's data in full detail.
The Broadway is the common spine to all these data. Along its 13 mile span, it unites such diverse neighborhoods as Wall Street, Greenwich Village, the Theater District/Times Square (with its synonymous musical culture), Morningside Heights or Hamilton Heights, forming the common backbone to all of Manhattan.
Data sources and processing
To do justice to this landmark of New York, we wanted to show its full breadth and scope. Thus, we tried to incorporate as many and as diverse data as possible.
Google's Streetview was the obvious data source, since looking at a photo immediately gives an impression of the street itself. Thanks to Lev's data grant we also had access to half a year of Twitter data in addition to Instagram data from Gnip. To complete the social media triumvirate, we also added checkins from Foursquare.
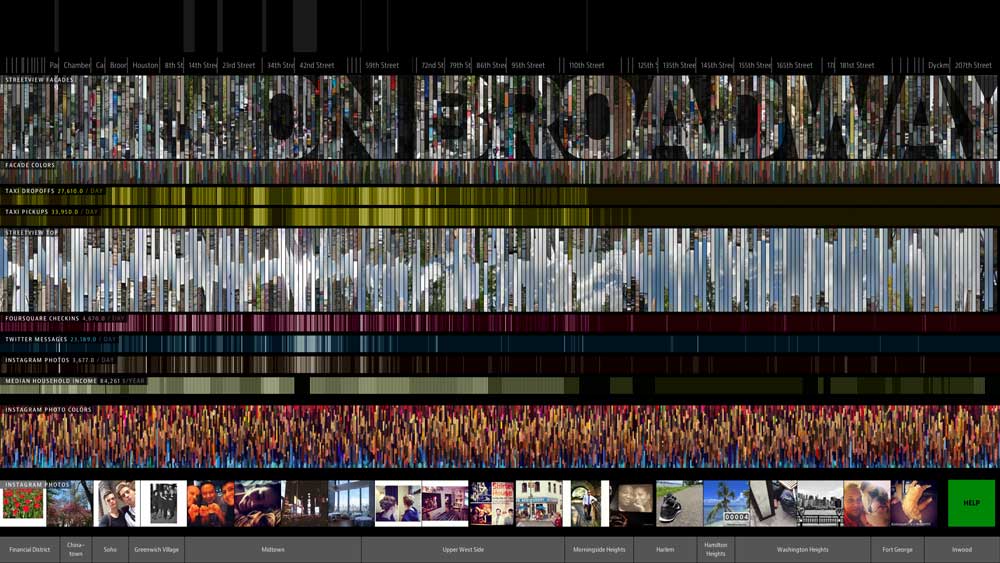
On Broadway uses various, quite diverse data sources.
Since photos from Streetview and Instagram are nice but visually dominant, we created additional, very narrow palettes of the dominant colors in the photos.
Another aspect of life along a street is movement: Chris Whong managed to free a full dataset of Taxi trips in Manhattan in 2013 via a FOIL request and made it available online (thanks Chris!).
Finally, we were also interested in income along the street, with New York being one of the most expensive cities in the world. Data from the American Community Survey (ACS) from 2013 provided us with access to this information.
While the landmarks along the street might be common knowledge for every New Yorker, we also (manually) added them to the dataset, together with a list of crossing streets.
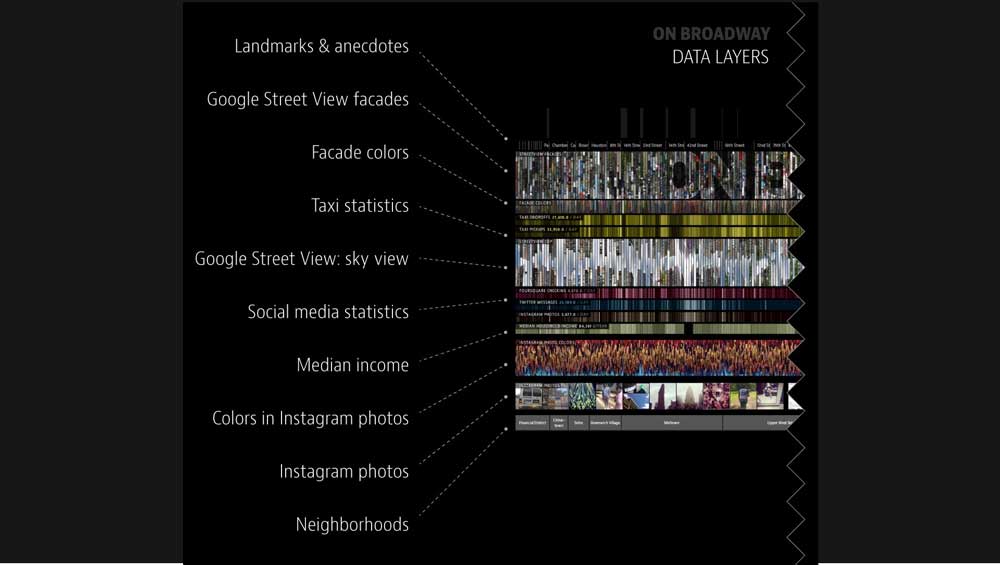
For filtering all these data sources, we used their geo coordinates and split up the Broadway into 30 meter segments (the dots on the lowest level in the resulting visualization). The results are several data layers stacked vertically, tied to the current position on Broadway.
Interaction and navigation
On Broadway's data set is overwhelming, not only for its creators. The sheer amount of images and other data led us to creating a straightforward way of navigating the application. The Broadway, just like in reality, works as a the backbone of the application. It is stretched horizontally, with Battery Park on the very left and Inwood on the right side. Initially, the full length of the massive street is visible to give an idea of its diversity and scale.
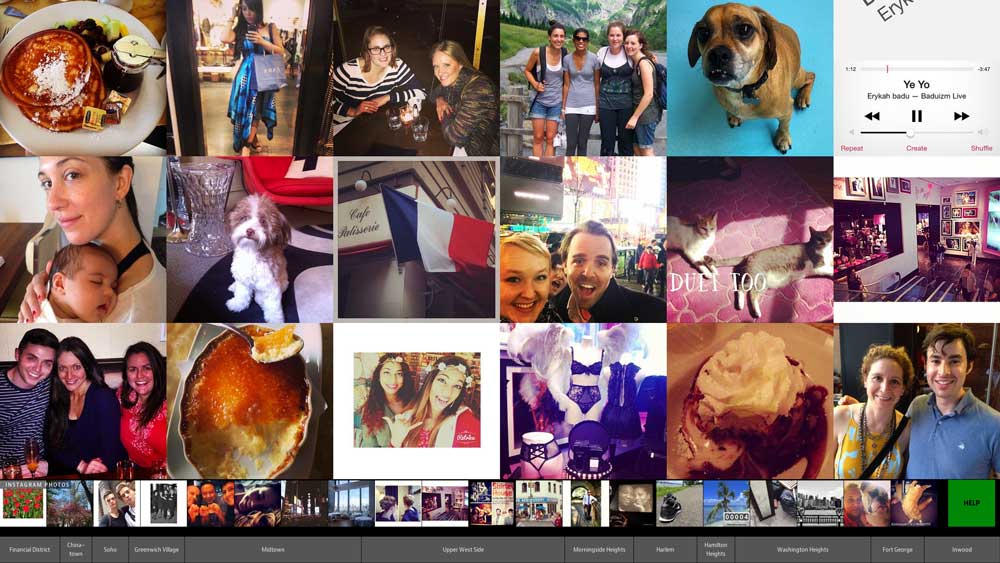
Broadway is of course also the place to take endless Instagram pictures.
From then on, it's all about tapping and dragging (since the app was originally built for touchscreens). Tapping anywhere zooms in. Dragging along Broadway moves all data layers. Alternatively, pinching can be used for zooming in or out and a big red 'Reset' button in the corner snaps the interface back to its initial state.
Since the amount of data speaks for itself we kept On Broadway's interaction at this simple level.
NYPL: Public Eye
On Broadway was launched in December 2014 at the New York Public Library's "Public Eye" exhibition. It has a glorious 50 inch touchscreen display set in a massive black wall at the entrance to the exhibition.
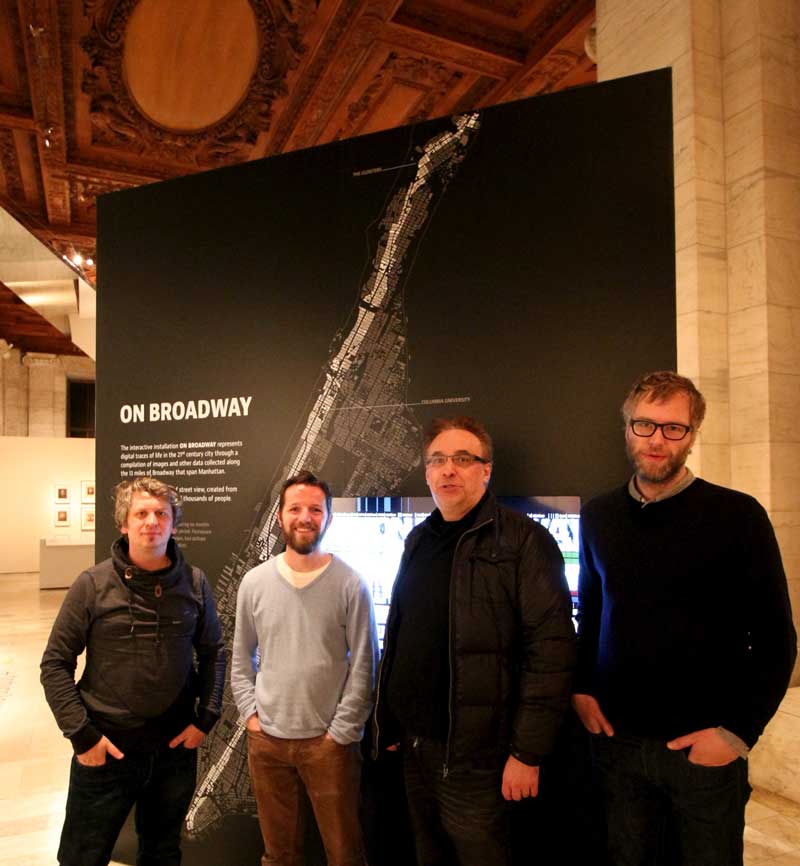
The relieved team in front of the result.
After days of on-site optimization and test runs (to make the app behave even after a long busy day) we were done and had fun watching people interact with the finished app. A big Thank You also goes to the team from the NYPL labs who supported us in this intense week.
Technology
Since we had the suspicion that On Broadway would also be launched on the web at some point, we decided to write it as a web application from the get-go. Every data layer is its own canvas-element and is redrawn for every interaction. The version running in the exhibit has its data available locally, providing a very fluent experience.
Still, there were a couple of shortcuts we took to improve the app's performance. I spent a couple of days fixing the obvious: as little DOM access as possible in the render functions, as many precalculations as possible, switching from SVG to Canvas for complex elements.
What bugged me greatly was the stuttering the app displayed when directly zooming from the initial overview to a point on Broadway (triggered by a tap anywhere). In this situation, the app shows an animated transition of all layers, looking as if the initial layers were stretched out large enough to focus on a single point. The initial animation simply increased the zoom-level and re-drew all layers as often as possible. Since the first part of this animation had to render some 700 pictures/rectangles/etc. per layer, this proved to be somewhat stuttery. Fortunately, our eyes are easily overwhelmed by all that's going on during that animation.
So, the obvious shortcut was to take the picture-layers (mainly the Streetview images) and scale them instead of redrawing them. They actually become quite blurry in the process, but this is hardly noticeable during the animation. From a certain point on (around half-way zoomed-in) the layers redraw again in every animation step, but the reduced amount of pictures makes this much smoother.
Public launch
After all these optimizations and successful weeks at the NYPL, On Broadway is now also available on the web. Simply go to http://on-broadway.nyc, click on the bright 'Open the app' button and dive into this massive dataset.