▶ Check out the selfiecity project
▶ Go straight to the selfiexploratory
We were blown away by the media echo for selfiecity. Here's some of the highlights:
▶ Wired: Fantastic Infographics, Drawn From A Study of Instagram Selfies
▶ The Atlantic - Cities: A Hilarious Study of Selfie Photos in 5 Cities Around the World
▶ Gizmodo: Cultural Stereotypes As Revealed By The Ultimate Collection Of Selfies
etc. etc.
In 2013 the selfie - a self-portrait taken with a phone with optional bathroom mirrors and/or duckfaces - had seemingly peaked in notoriety: 'selfie' became Oxford Dictionaries Word of the Year, presidents took selfies at funerals and crazy things were happening at the selfielympics. Things looked shallow indeed.
What's easy to miss, though, is how selfies are a fascinating target for analysis: especially in their instagram incarnations, they're a massive data set offering a unique glimpse into the public psyche. Selfiecity is our stab at what studies of such data can look like, methodology- and result-wise.
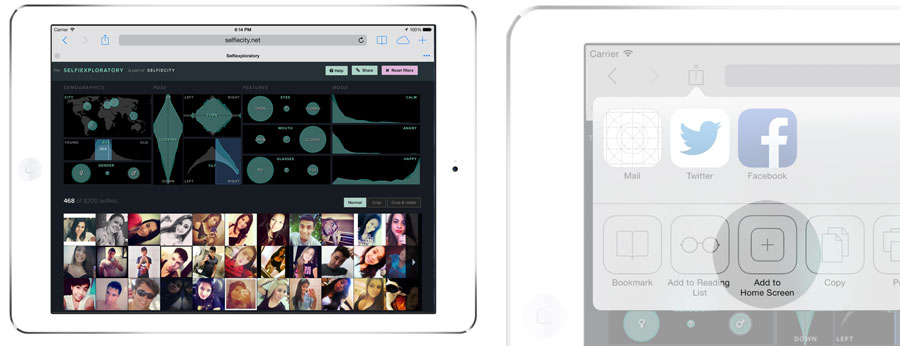
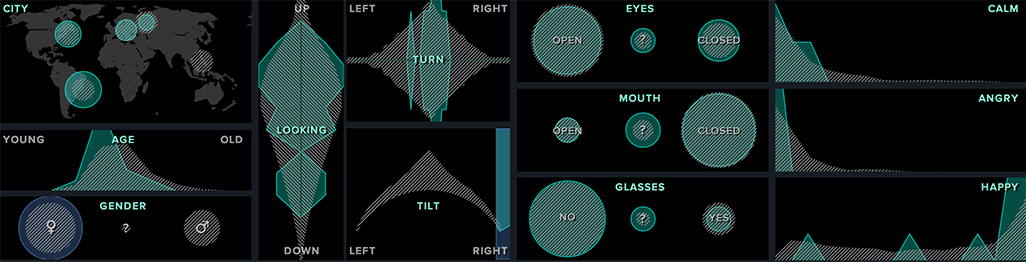
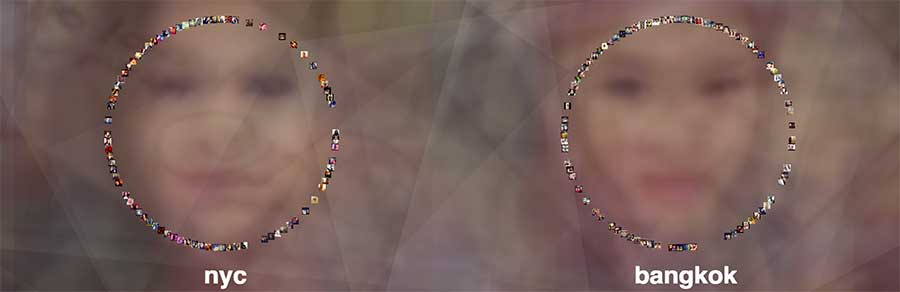
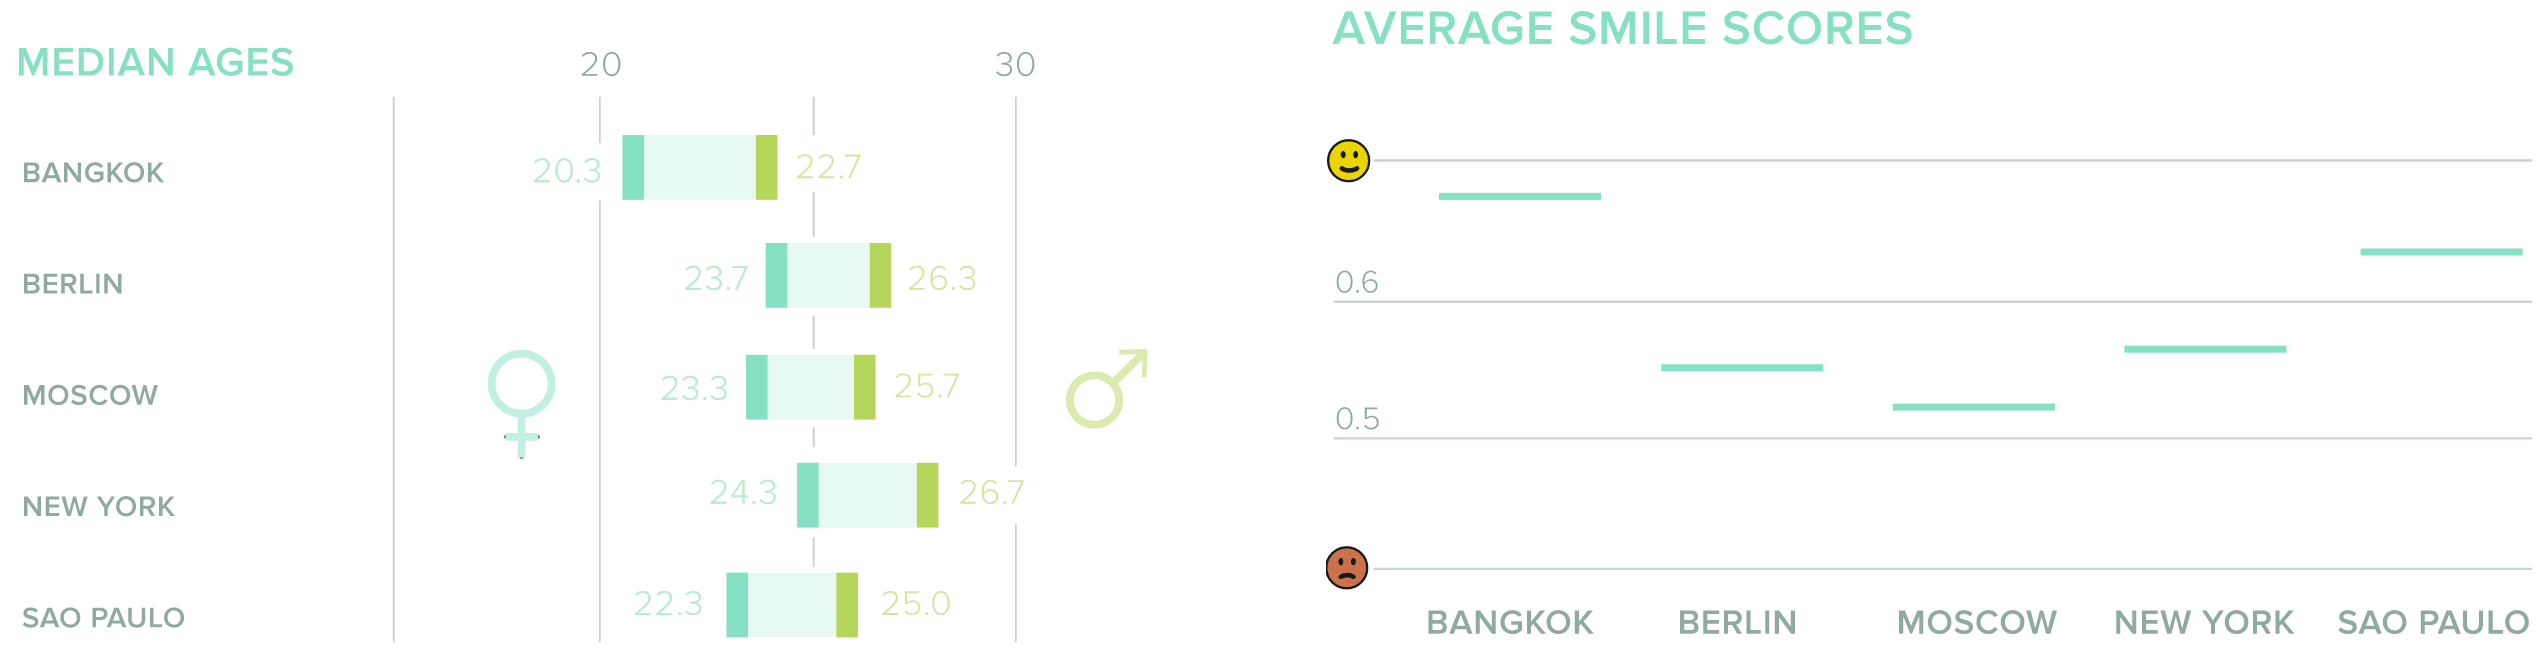
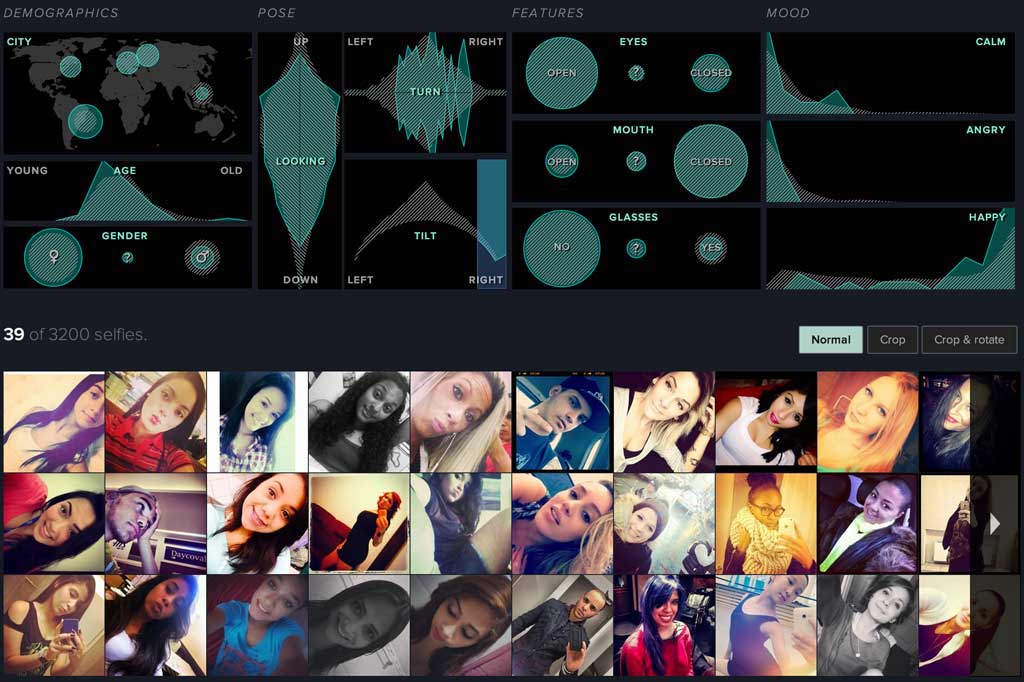
In this project, I've had the chance to collaborate with an amazing team of people, among them: Lev Manovich of phototrails fame and new media theory legend who had the project lead and the constantly-fantastic Moritz Stefaner guiding the creative direction. Daniel Goddemeyer developed the original concept and to complement the data-driven approach and make sure that we captured the selfie phenomenon from every angle (scnr), we had strong theory-driven discussions by Alise Tifentale, Nadav Hochman and Elizabeth Losh. Initial endeavors in web-based face mash-ups After some initial experiments exploring fun selfie montages (see this vimeo album) and WebGL-based image mashers, we settled on the idea of exploring cultural differences encoded in selfies. Starting from roughly one week of Instagram photos from six cities (New York, Sao Paulo, Berlin, Moscow, Bangkok, Tokyo) provided by gnip, our data wiz Mehrdad Yazdani extracted the selfies (relatively rare at around 4% of all pictures) using a custom-built computer vision approach. Afterwards, we mashed them through our cyborg data-extraction blender: Amazon's Mechanical Turk workers identified gender and age, while the Rekognition API provided us with automatically generated infos about head position, features such as a glasses and four main moods (more info about the data set). Our findings through statistical analyses confirmed some suspicions (more women than men take selfies, most selfies are taken by young people), but also showed cultural differences between our five locations: people in Bangkok and Sao Paulo smiled more than those in the northern hemisphere counterparts and the gender difference was especially extreme in Moscow with 82% of all selfies being taken by women. One part of selfiecity that I'd like to highlight is the selfiexploratory, an interactive tool to explore all 3200 selfies in our dataset and their connected metadata: The selfiexploratory: Use the interactive filters in the upper half. Look at the resulting selfies in the lower half. Repeat. The selfiexploratory was born out of our need to verify the results of our data analysis. Both Turkers and Rekognition might err for certain photos or dimensions and we wanted to be able to browse the results and spot such mistakes. Similarly, we were looking for a quick way to extract very specific selfies from the dataset: all New Yorkers over 30 looking to the left, for example (never know when that might come in handy). The tool displays charts for all data dimensions in the upper part of the screen. These charts can be filtered either by clicking (for example, to select a city or a gender) or drawing a brush (for example, to select a certain age range). Once a filter is set, the lower part of the interface shows all selfies that obey these filter settings. Multiple filters can be combined to create more specific filter combinations (for example, women over 30). Additionally, all charts are interconnected: if a filter is set in one graph, all other charts reflect their distribution for that subset in cyan while still showing the overall distribution in the background. All charts in the selfiexploratory are interconnected and reflect the current filter settings. The basic idea for such a tool were Moritz' Elastic Lists, a UI approach with coordinated views for browsing faceted datasets. If you compare the selfiexploratory to Moritz' List of Nobel prize winners you can see the relationship. But as Flash is a four-letter word on the web, we made the selfiexploratory all new and shiny and HTML5. The selfiexploratory is built on the wonderful d3.js for chart generation. A custom chart templating system along the lines of Mike Bostock's reusable charts pattern let us quickly create new charts or re-arrange the existing ones on the website. The main piece, however, is the crossfilter library. Crossfilter is able to filter very large datasets in realtime which let it quickly slice through our 3200 selfies and their twelve dimensions. Every time you drag a slider or click on a bubble in the selfiexploratory, crossfilter updates all dimensions and d3 re-renders the charts seamlessly. Selfiexploratory running on an iPad (left) and how to add it to the home screen (right). This combination is so fast, in fact, that it even runs brilliantly on mobile devices: I've spent a day to make selfiexploratory behave on phones and tablets and now it is a joy on the iPad: setting and changing filters is much nicer when you can do it directly with your fingers. The selfiexploratory is also web-app-compatible, so you can have it running in fullscreen and get a nice icon on your home screen. Finally, one thing we wanted to have is people being able to share filter settings via URL. When you click on the Share-button in the upper right corner, selfiexploratory generates a URL for your current filter settings. This makes it easy to share photos of angry young men, happy people with tilted heads or all New Yorkers over 30 looking to the left. More about selfiecity: Moritz' take on selfiecity, his talk about selfiecity at Visualized and some agenda-setting: <a href="http://well-formed-data.net/archives/1027/worlds-not-stories" target=_"blank">Tell worlds not stories!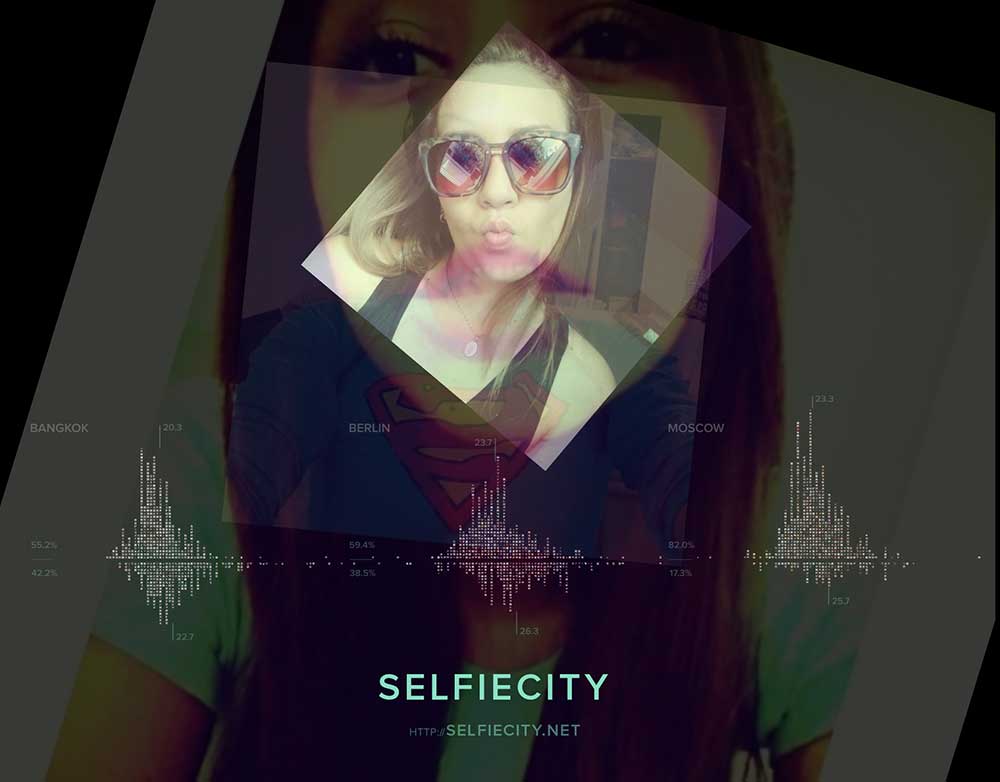
</img>
<br/></div></a>Turning selfies into data
The selfiexploratory
</img>
<br/></div></a>
This lets you interactively explore our findings. Say we want to check if the gender distribution indeed flips for older people so that more old men than women are taking selfies. To verify that, we select a region of the age-chart, move it to the right end of the scale and tada: in the gender-chart the cyan bubble for men is visibly bigger than the one for women.