Rhythm Of Food
Rhythm of Food shows how people's interest in food fluctuates throughout the year.
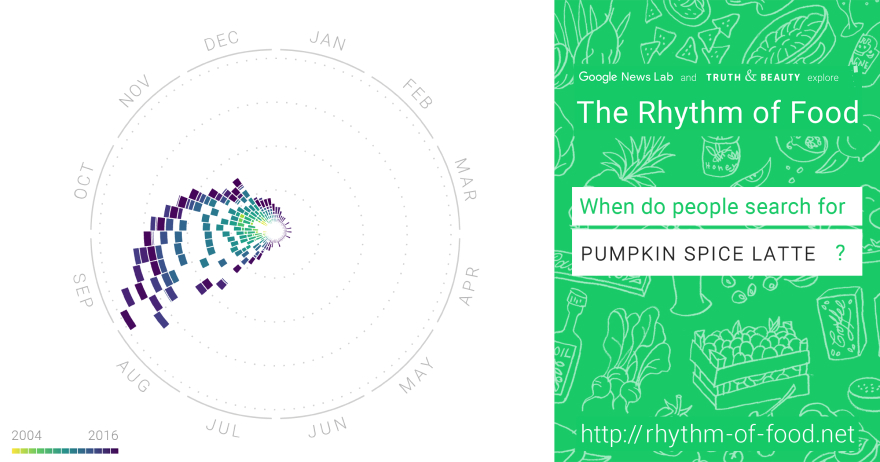
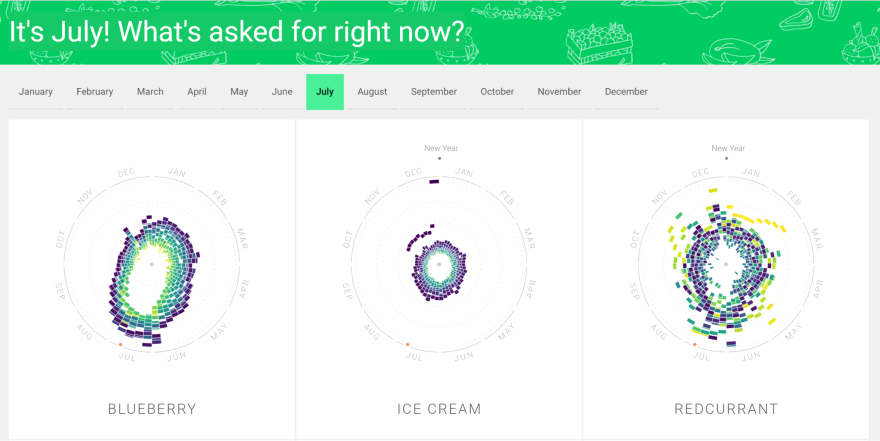
Anecdotally, we're all aware of the prevalence of ice cream in summer and pumpkin spice lattes in fall - but does the data reflect that? In collaboration with Google, Moritz Stefaner looked into this question.
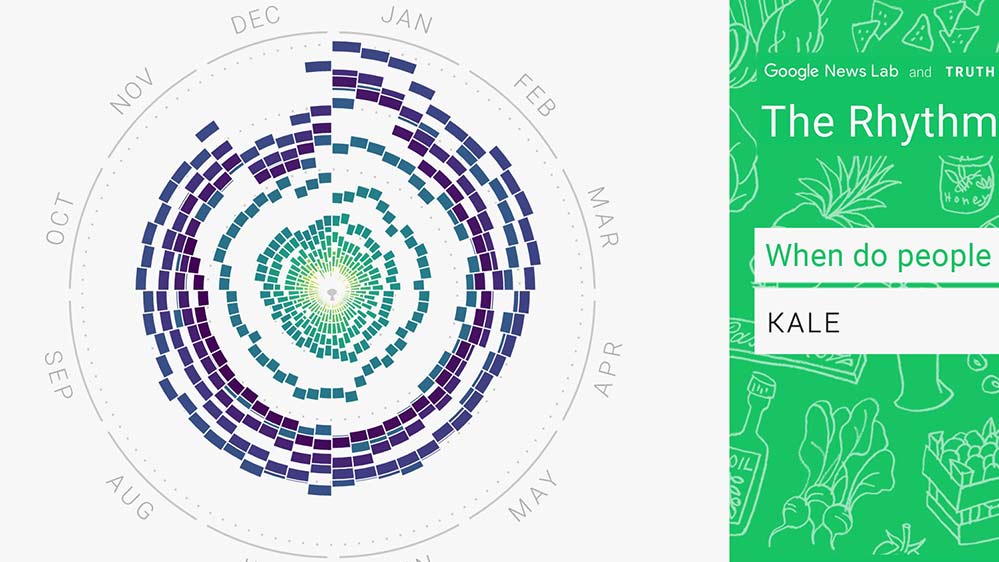
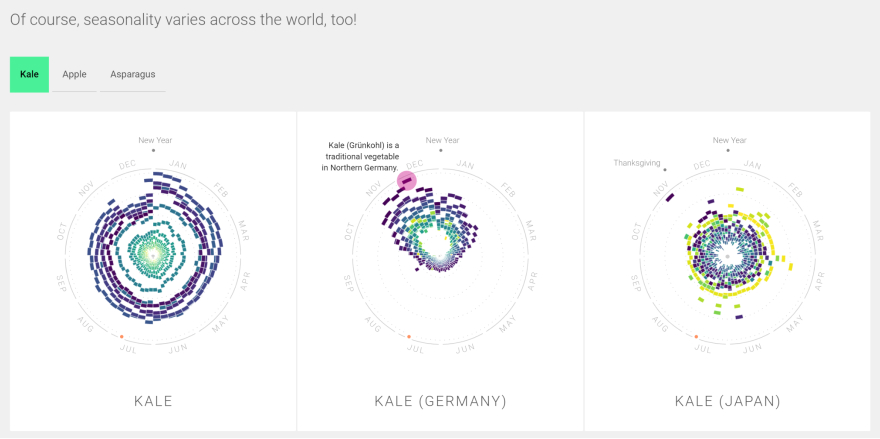
The Rhythm of Food visualizations plot color-coded search interest on circular charts, showing both the fluctuation throughout the year and the search interest since 2005. Fascinating patterns unfold and highlight not only the seasonality of food, but also international differences (like the clearly defined asparagus season in Germany).
My responsibility as development support in this project was enabling easy sharing for the charts across various social networks.
Selected Press
WIRED: Fascinating Charts Reveal What Foods Americans Have Been Googling
Scientific American: Visualizing the Rhythm of Food
Tech
React
d3.js
mobx
Chrome extensions (screenshots)