Tangle & Strings
The history of songs to which a person has listened to is a very personal piece of information. It is a rich data set that comes as a by-product of the use of digital music players and can be obtained without interfering with the user. In this paper, we present three visualizations for this data-set and a mechanism for generating new playlists from the user's own listening history, based on a navigation metaphor.
First, temporal proximity is interpreted as a simple similarity measure to lay out the entire history on a two-dimensional plane. Closed listening sessions are then used to make chronological relations visible. The generated playlists mimic the user's previous listening behavior, and the visualizations make the automatic choices understandable, as they share visual properties with the history. In this sense, our visualizations provide a visual vocabulary for listening behaviors and bring scrutability to automatic playlist generation.

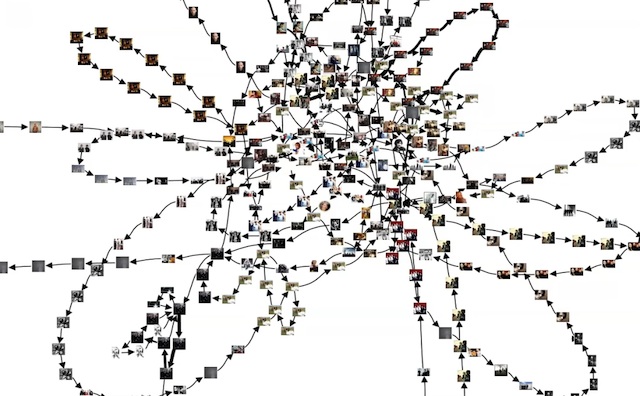
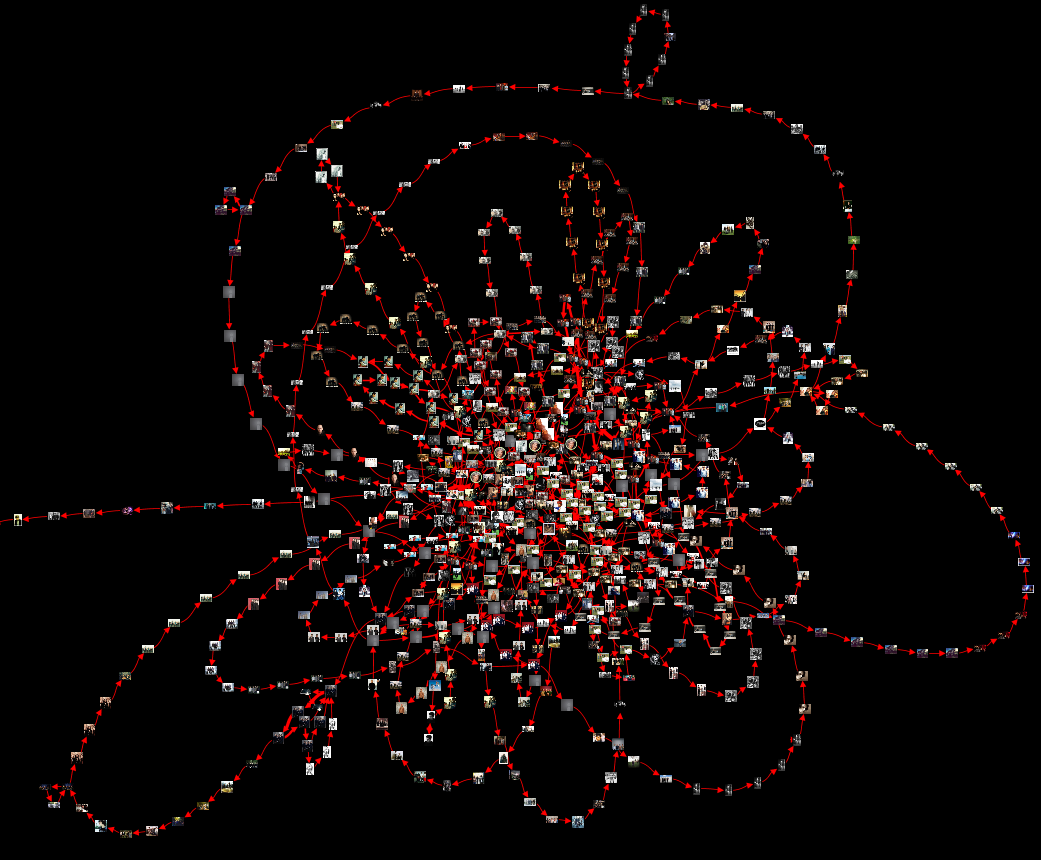
Tangle: A personal music listening history visualization that connects all songs based on the sequences they were played in.
A first visualization, called Tangle, provides a global view of all songs in one listening history. We make the assumption, that a person has listened to all songs in her collection at least once (so every song is visible), which makes this visualization a tool to work with a complete music collection. The listening history is represented by one long sequence of songs, as people normally listen to only one song at a time (at least voluntarily). By itself, this sequence is only marginally interesting. Finding connections between songs (e.g., identical ones, songs by the same artist etc.) can provide much richer information. As described above, a listening history can serve as a similarity measure between songs. If two songs were listened to at least once after one another, they are assumed to have some relation.

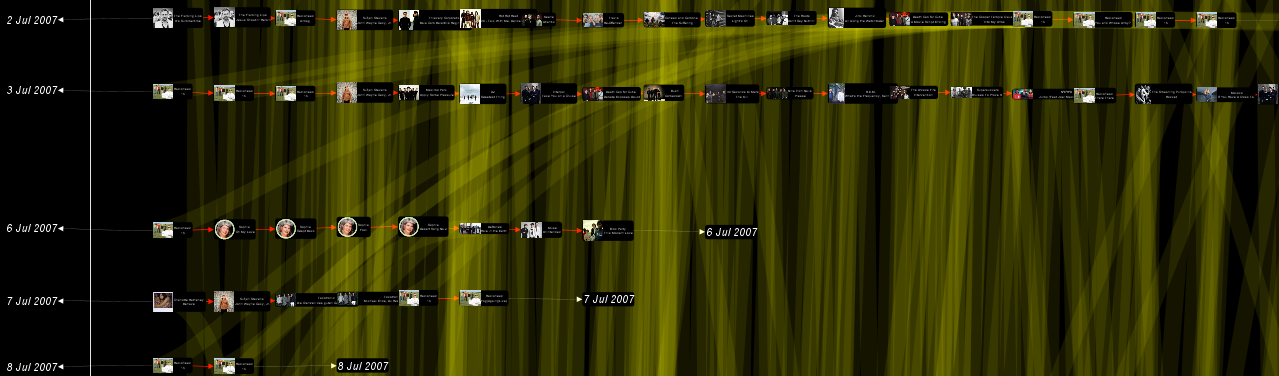
Strings: Another visualization, focusing on listening sessions, i.e., songs in a row.
A listening history can be subdivided into listening sessions of varying lengths. In the Strings visualization we exploit this fact and display these sessions as
horizontal strings of songs that are sorted chronologically from top to bottom. Every song is shown with a picture of its performing artist, making visual grouping
easily possible. Labels for different months and years provide orientation even at high zoom levels. In this type of visualization, identical songs are no longer represented by one node, but possibly by several nodes in different Strings. Identical songs are connected by semi-transparent wide yellow lines. In terms of interaction, the user can again pan and zoom the whole display to get an overview or focus on one certain section of time. To explore changes in the layout, the user can manually reposition nodes if necessary. A click into empty space returns to the original layout.
Tech