
Update: Jeremy Stucki from Interactive Things quickly hacked together an impressive demo of >500 animated, flower-like shapes in SVG - showing that complex animations can also be done using vector graphics. Still, it lacks some of the details (gradients! text labels!) and while working great on a reasonably fast laptop, it's similar in speed to our Canvas-BLI on an iPad 3/iPhone 4S. So, yes, SVG lets you do a lot, but I would still argue that the low-level Canvas is a tad faster.
One thing that people tend to forget in today's HTML5-ed world is how extremely fast Flash actually was and still is. Constructing complex chains of tweened animations and having them run in real-time was absolutely doable and represented a major advantage compared to other in-browser graphics frameworks such as Java. And, as wonderful as HTML5 is, we're still at least a couple of years behind in that regard. HTML5 is not the magic bullet that saves your device from high battery or CPU consumption and, yes, you can create memory leaks in Javascript and crash your browser.
I had to learn the restrictions of HTML5 with the revamp of the OECD's Better Life Index. In this blog post I will describe some of the approaches and solutions that we used to get the HTML5 version of that visualization on equal footing with its Flash ancestor.
The Better Life Index (BLI)
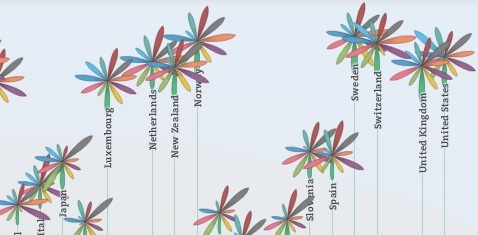
The OECD Better Life Index (BLI) is an appealing, web-based visualization of various quality-of-life indicators for a set of 36 countries. Personal preferences can be set for each of these indicators to get a personal ranking of countries. You could, for example, express your desire for high 'Safety' while downranking 'Environment' to find that Canada really is the perfect country for you.
Every time these settings are changed, the flowers representing the countries adjust by changing their petals' colors and sizes (each petal represents one quality-of-life indicator). Moritz Stefaner didn't hold back when designing the Flash original and crammed in as many animations as possible:
Flower animations in the (Flash) Better Life Index (click to see the animation).
Every change in settings potentially leads to changes in a flower's petals' colors, orientations, sizes and a position change for the flower and its label. With 36 flowers with 11 petals each on-screen you can imagine how this might lead to problems, performance-wise.
So, how do you re-create something like that without your comfy Flash tweens and animations?
Minimize overhead, go as low-level as possible
One initial decision we had to make was between rendering to SVG or Canvas (WebGL is very promising but still lacks support). Both graphics technologies are well-supported in modern browsers but come with very different qualities: SVG is a vector-based format that represents basic geometric bodies as DOM-elements and gives you all the nice things that DOM-elements have such as event handlers tied to objects. Canvas is, as the name implies, only a blank slate bitmap with several helper functions for pixel-based drawing - no more, no less. Oh, and all this event handling: yeah, you have to write that yourself.
Actually comparing the performance of SVG and Canvas is tough, as it depends on both the size of the drawing area (that adds to drawing complexity in Canvas) as well as the number of objects (that adds to DOM-overhead for SVG). So simply displaying a single bouncing cube might not be enough. Microsoft (yes, the Internet Explorer Microsoft) has a great comparison write-up between the two technologies.
In a nutshell, your choice between SVG and Canvas depends on the drawing area and the number of graphical objects:
| SVG/Canvas | Canvas | |
| SVG | probably Canvas, but seriously: you're screwed |
With our close to 500 objects (flowers, petals, stems, labels) and an almost full-screen visualization we were right in the middle of screwed-up country. Fortunately, we managed to shift the problem a little bit towards the top by splitting one large Canvas into many small ones (see below). But in any case: if in doubt and performance is important, Canvas always means less overhead and more control over the results, so we went with Canvas.
In the same vein, we initially used Paper.js for drawing. Paper.js is a fantastic Canvas library for creating complex vector-based graphics. It gets you pleasantries such as a scene graph or being able to tie event handlers to Canvas objects. But all of that comes at a price, as Paper.js creates - very similar to SVG - an additional amount of overhead for each graphical object. So, while Paper.js let us quickly recreate the visualization in HTML5, the result wasn't very fast. In the end, we dropped Paper.js and used native (=pure Javascript) Canvas-drawing for everything.
The more elements, the better
Most performance-downsides of Canvas elements come from redrawing them. As Canvas is more or less a dynamic bitmap, every time it is redrawn your visualization's performance takes a hit. This heavily depends on what your drawing function looks like: it even makes a difference how you clean your Canvas before drawing something new.
Another trick is to make sure that you only draw as little as possible: if only the upper-right corner of your Canvas needs an update, make sure that only that part is cleaned and redrawn and not the whole thing ('dirty rectangles' are one way from computer graphics to keep track of that).
You can also minimize drawing time by having as little calculations as possible in the your drawing routine (see below).
But important for us here and just as you would expect, the performance hit correlates with the size of the Canvas element: redrawing a screen-filling Canvas takes much longer than redrawing a tiny 10x10 pixel element or even several hundred of them. So it always makes sense to split up your graphical objects into as many smaller versions as possible (except when you're using a library that creates additional overhead for every new object - which brings us back to going as low-level as possible). While we started out with a single Canvas that contained all flowers and their labels, in the end we had one Canvas element per flower (as the middle ground between giving each flower petal its own Canvas) and each flower label as a separate div element containing text:
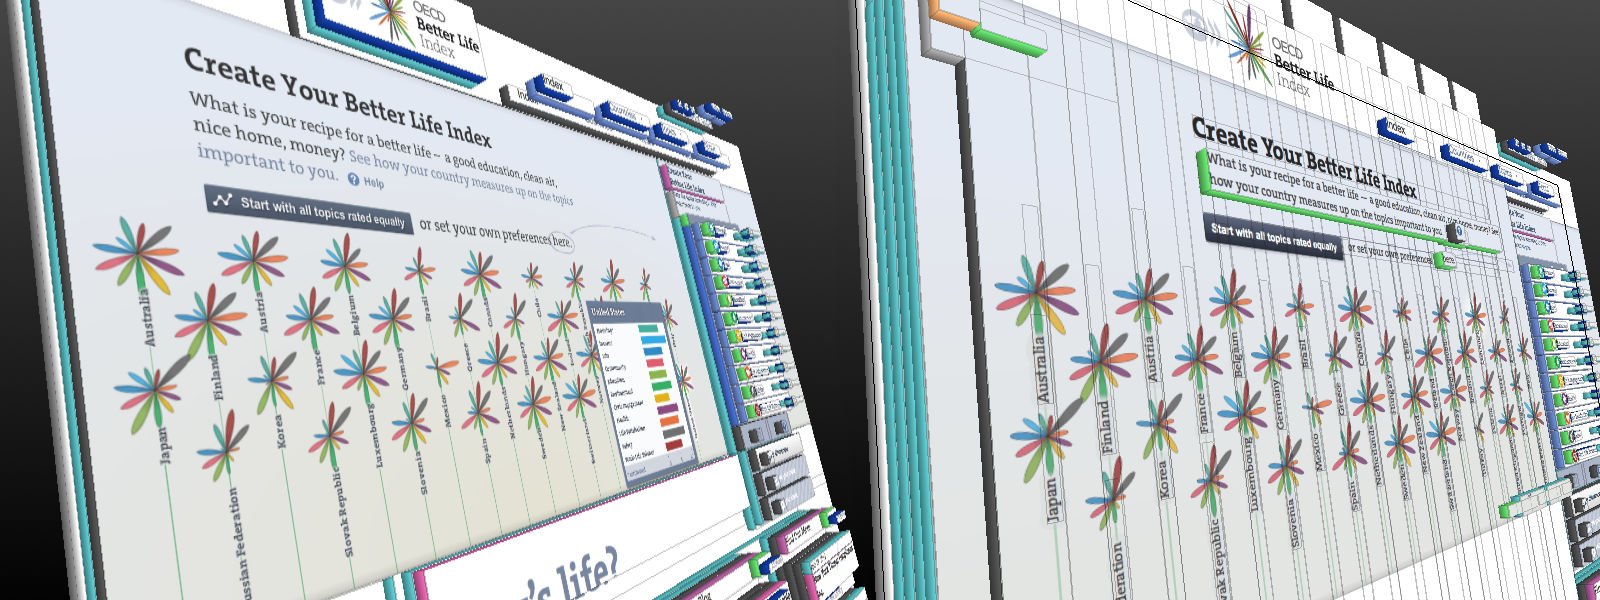
Splitting up larger elements into smaller one usually gives you performance benefits. Initially, the BLI had all graphical elements on a single Canvas (left), but we ended up with one Canvas per flower (right).
Having each flower as its separate DOM-element also gave us the advantage of being able to use CSS3 animations.
CSS3 animations
Usually when you need to do animations you would rely on code. Hook into the requestAnimationFrame function for optimal performance, use a tweening library for calculating your animation frames and write a little draw loop for drawing all that.
This, however, has the problem of your code forcing the animation on the browser. Browsers are optimized for rendering and usually have a pretty good idea of how to do it as fast as possible. But Javascript-animations are a black box to them: after calling the requestAnimationFrame-function the browser has no clue what will happen, how many and what rendering operations are required and what frame rate the code will try to enforce. It just tries to do its best, but often ends up in a tumble of too many colliding animations with too high a frame rate.
CSS3 animations promise to solve that: as animations are no longer hidden in the black box of code but explicitly communicated to the browser through CSS, the browser can adjust its rendering activities to that. This usually means that animations look much more fluid and produce less collisions. And finally it also means less code: skip all the tween calculations and simply tell the browser that you want object X go to position Y with easing Z and you're all set.
In the BLI, all animations moving whole flowers and their labels are pure CSS3. As each flower had its own Canvas-element we could simply tie the animation to that element and let the browser take care of the rest. The transit library for jQuery was a great help in setting up these animations.
Precalculate all the things!
Unfortunately, not all animations are as simple as moving object X from A to B. More complex animations usually can't be expressed through tweening and have to be calculated. Relying on CSS3 animations is not possible and you need to calculate each frame's outcome and draw it in code.
Using things like requestAnimationFrame (you really should) and optimizing the draw loop (have many small Canvas elements, only redraw dirty regions) you can already get good results. But one weird trick (browser developers hate) made our animations feel much faster.
Animations we couldn't assign to CSS3 were the complex petal behaviors. When changing settings for one of the indicators, usually each petal's orientation, gradient color and size adapts. For every 11 petals on each of the 36 flowers:
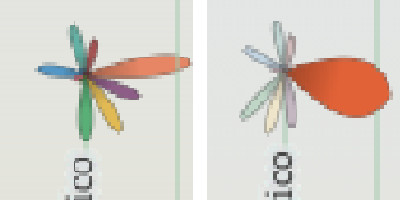
Complex, non-CSS3 animations should be precalculated. Here: changing the personal preferences leads to changes in orientation, color and size for each flower petal.
Doing the necessary calculations in the draw loop completely killed our performance. The calculations just took too long and interfered with the browser's frame rate and led to ugly janks. As we had to do these calculations at some point, we decided to do them beforehand: once the settings are changed, the visualization spends an imperceptible 700 milliseconds with calculating colors, orientations and sizes for each of the 396 flower petals and as many frames as possible. All these precalculated animation frames are stored and then played back. The draw loop itself is completely devoid of calculations: It just takes all precalculated frames and redraws the petals accordingly.
Interaction with a canvas: low-resolution maps
Similarly to precalculating your animations, it also makes sense to precalculate some of the interactivity parts. Splitting up your single Canvas into many smaller Canvas-elements gives you the advantage of being able to tie event handlers to them, ameliorating one of the major downsides of a Canvas. As we wanted people to be able to hover over a flower to get more detailed information on a hovercard, we had to make our Canvas interactive.
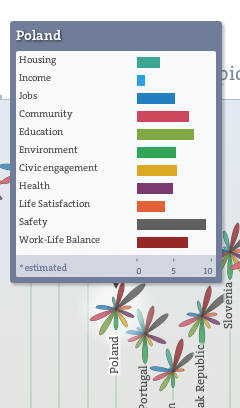
Hovering over a flower shows a hovercard with more details on the quality-of-life indicators.
Unfortunately, we couldn't just tie event handlers to the flowers. Each flower Canvas is much more spacious than the petal region, as it also contains the flower's stem and additional space for drawing optional comparison markers (compare your own preferences to the averages to see them). This would have led to the event handlers firing even when the cursor was still far away from a flower's petal.
Therefore, we have our mouse event handlers only tied to the background Canvas and not the flower Canvas elements. Every time the mouse moves we have to check whether a flower element was entered (or left) and react accordingly. This requires some simple collision detection (each flower's petals work as a circle with a radius), but can cause quite a performance dent if done for 36 flowers each time the mouse is slightly moved.
Again, precalculation to the rescue: every time the flower layout changes (which happens far less often than a mouse move), we calculate a low-resolution map of the flowers (basically a two-dimensional array containing a flower's ID or 0). When the mouse move event fires, we can then simply drop the mouse position into the low-resolution map and see which flower pops out.
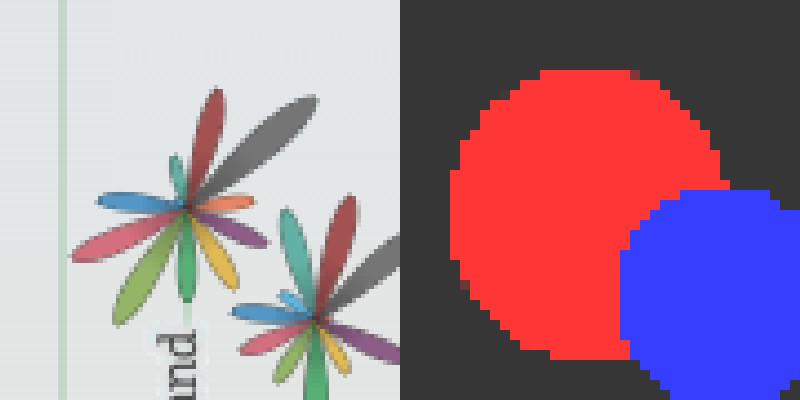
Instead of doing collision detection every time the mouse is moved, we can precalculate a low-resolution map of the flowers after each layout change and use the mouse coordinates with it.
In conclusion
Transferring the BLI from Flash to HTML5 was a great learning experience and I hope you can benefit from these lessons. Overall, the trick is to shift as much work as possible from your code to the browser, because the browser is usually much more optimized than your code can ever be (let's be honest here).
In addition, you should also be aware of the smaller things: only redraw as little of the Canvas as possible, use translate3D instead of translate to make use of hardware-acceleration, know your dev tools (Google has some excellent videos on that), etc. etc.
Did these recommendations help you? What would be even better/faster? Let me know in the comments!