▶ Check out Subspotting
▶ Check out the Subspotting App
If you've ever been to New York, you most definitely have used its extensive and (somewhat) reliable Subway - the easiest way to travel through the city. And if you took a look at your fellow passengers you might have noticed that at certain points on the line, people frantically started tapping and swiping their phones only to let go after a bit with a disappointed face.
How bad is cell phone reception on the New York Subway really?
New York City is one of the few remaining metropolis without comprehensive cell phone reception on their subway system. Governor Cuomo promised to fix that, but until then, people are relying on the few patches on any given line where stray signals from overground reach the train.
But how bad is it really?
That is the question that Daniel Goddemeyer and I asked ourselves when starting on Subspotting. In the process, we ended up collecting a massive dataset, and turned it into two decorative posters and a handy iPhone app.
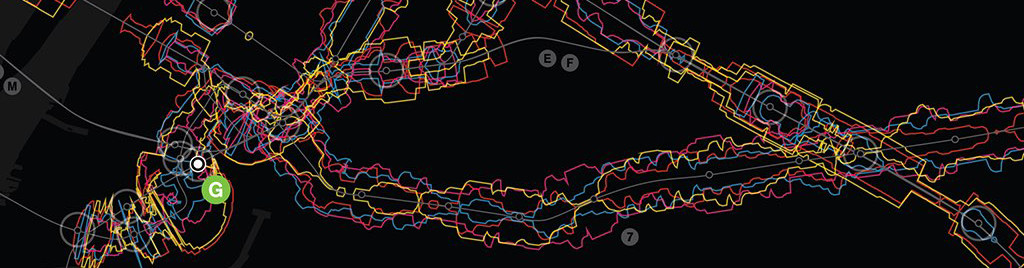
One of the results of Subspotting: Subway cell phone reception on a map
High hopes
Initially, we were quite confident that this would be a fun and quick project. Everybody uses cell phones and New York is known for its great open-data initiatives, so the data has to be around somewhere. After scouring the web for a bit, we realized that it might not be that simple. Aside from a closed data study by the MTA and this website logging cell phone reception throughout the city (but only aboveground), this very special data type was hard to come by.
We realized that we had to collect it ourselves.
It was then that the project could have failed. Let's call it inflation point #1 where it becomes clear that not everything will be as simple as expected and you have to decide whether to do it right or just quit. From my experience, every project reaches that point after a while. For Subspotting, we decided to do it right.
The current record for riding the complete NYC Subway is roughly 22 hours.
Riding the whole NYC subway is quite a feat, given its overall length is 660 miles of track, and finding the shortest route that covers all stations has even become a competition (also known as the Subway Challenge). By the way, the current minimum time to cover every station is 21 hours, 49 minutes and 35 seconds).
Since technologists are notoriously lazy, we planned to have our users collect the data themselves. We would create an initial dataset by riding the subway for a while. In a beautiful form of crowdsourcing, we would then launch an app that displayed this cell phone reception data, while logging the same data in the background and sending it to our servers. This way, the data would continuously improve.
It was a nice plan. And didn't work. This time not due to technical reasons but because of Apple.
Getting signal data on iOS
Oh Apple, you cruel but irresistible tech overlord.
I quickly found the code to measure the current cell phone signal in an iPhone app. It's actually quite simple, readily available, and has been around for a couple of iOS versions:
    // Link project to CoreTelephony.framework
    int CTGetSignalStrength();
    int signalstrength = CTGetSignalStrength();
This is how you get cell signal strength in iOS. But only naughty kids would do that.
It's part of the CoreTelephony framework, which also lets access you other useful info about your phone's cell and WiFi signals programmatically. It opens the door for apps that log your cell reception, collect this data and let you know which is the best provider for your city. More or less exactly what we had planned for the subway. Which probably led Apple to declare this library private.
One thing you learn quickly when you start developing for iOS is that not all apps are created equal. Whether you can use a certain function or talk to the phone's OS in a certain way is not only a matter of such a function's availability, but also if Apple wants you to. Available frameworks in iOS are separated into normal and private. Private frameworks are more powerful, dangerous and cannot be used if you want your app to appear on the App Store (you can, however, install such apps by jailbreaking).
So our beautiful plan of creating a data access/data logging app where people would improve the data just by using it was dead. And we prepared for spending some time on the subway.
Data logging
We wrote a custom app that logged the cell phone signal in two second intervals. While it's not possible to use private function calls in an App Store app, as a developer you can deploy whatever apps you want to your device.
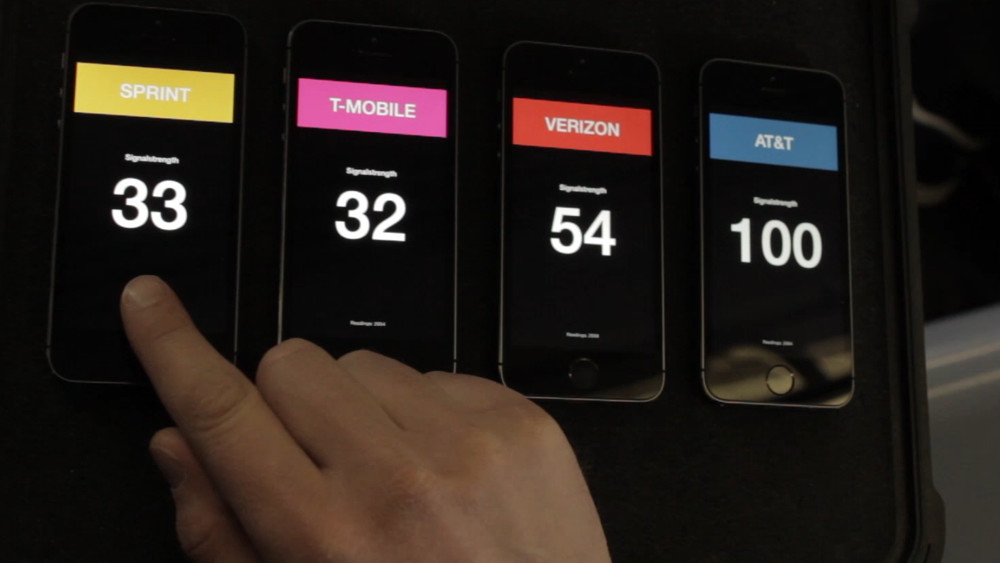
Our custom data logger in action.
The custom app can take up two different roles. One is that of the self-consistent data logger. This very simple role just starts collecting cell signal strength as pairs of timestamps and numbers as soon as it's launched. Cell phone strength is measured in dBm, but Apple's framework turns it into an integer value between 0 (no signal) and 100 (full reception).
The more complex role is the location logger.
Since we didn't have GPS reception on most of the subway either, we needed a way to map our signal strengths to locations. The most reliable but also cumbersome way was manual - which we ended up doing. So the location logger role of the app lets the user select a subway line and direction and asks her to press a button every time the train reaches or leaves a station.
Every such event (arriving at a station, leaving a station, etc.) is logged with a timestamp. Now you only need to sync the timestamped signals with the timestamped events and presto - you have your signal strength dataset.
Going for a ride
Daniel went to the Apple Store, bought five iPhone 5s (one as location logger and four for each of the major carriers), put them in our non-shielded case and went on his way.
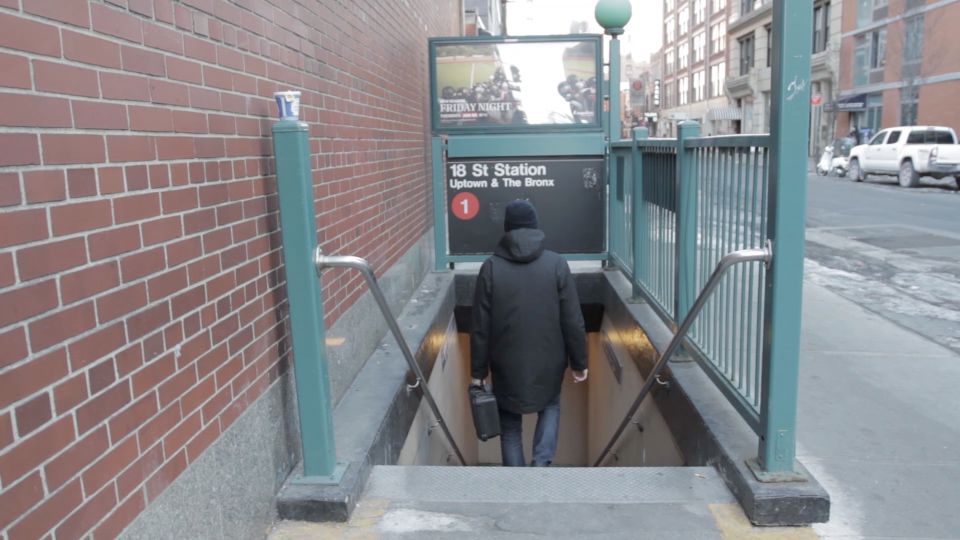
Logging the subway - a dirty job, but someone's (Daniel) gotta do it.
Well, to be honest, Daniel didn't do everything himself. At some point, we recruited a TaskRabbit who seemed super-enthused to be able to ride the subway, read a book, press a button sometimes and get paid to do it.
Since we weren't trying to compete in the Subway Challenge, we tried to be smart about capturing the data: while we went on each line twice (once in either direction), we covered tracks that are shared by multiple lines not multiple times. The 1, 2 and 3 trains, for example, share the tunnels between Chambers St and 96 St - which means we only logged this section once (well, twice - once forward, once backward).
Roughly 11 days later we had all the data.
Data cleaning
Now came the fun part (not). Data cleaning/wrangling/ninja-ing is usually the ugly underbelly of every data-driven project. It's extremely taxing on mental resources and things can very easily go wrong if you're not focused constantly.
It's also the domain of scripting, since mangling the roughly 1.6 million data points we had collected manually would take a while. By now, I prefer using Javascript for that, either as a node.js script or directly in the Chrome DevTools.
Data cleaning/ wrangling / ninja-ing is usually the ugly underbelly of every data-driven project.
As a first step, we calculated the correlation between our data from going forwards to backwards on one line. This was our sanity check to see if the measurements even made sense. Finding a big difference between measurements on the same train just going in a different direction would have opened up a whole 'nother can of worms (place on the train is important, time of day is important, etc). Fortunately, our correlation was extremely close to 1 - meaning that the signal on a line is more or less the same independent of your direction, the time or day, etc. (our measurements were made on various weekdays and at various times).
The small things don't really factor into the quality of the signal. What's way more important is if your train is running aboveground or underground. Especially bridges (for example on the D train between Manhattan and Brooklyn) are extremely helpful for getting a good signal. We manually added this overground information to our dataset.
Our debug visualization for data cleaning
Visualization can help a lot with spotting mistakes and problems while cleaning the data. I wrote a web-based debug visualization for the full data set. This had a size of roughly 50MB, so wasn't really suitable for publishing anywhere.
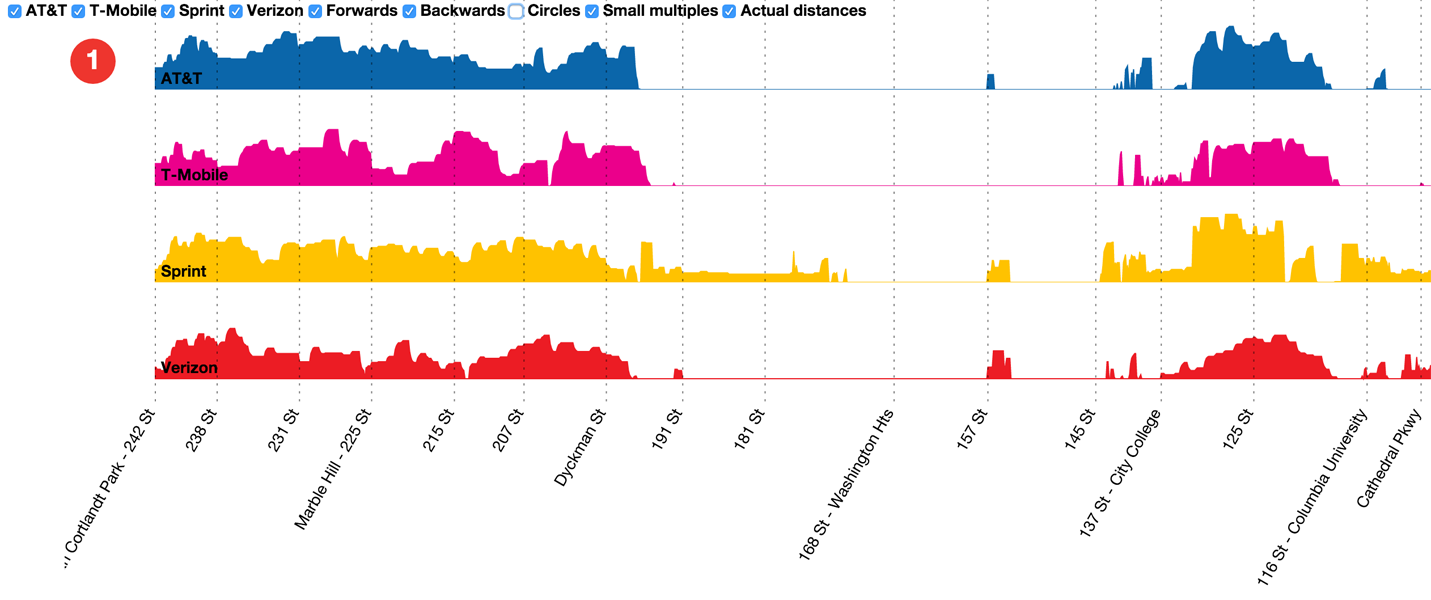
Since we needed a way to break the data down, I additionally wrote a couple of scripts that would bin the data - moving from one measurement per two seconds to one per minute or more. The app, for example, provides two views on the data: one 30-measurement overview for a line and a more detailed version after zooming in.

Our app provides data in two levels of detail
Talking about the app...
Getting stuff done
After a lot of time spent on getting the data right (talking about inflation points), we were finally able to create tangible outcomes.
One of them is our iPhone app.
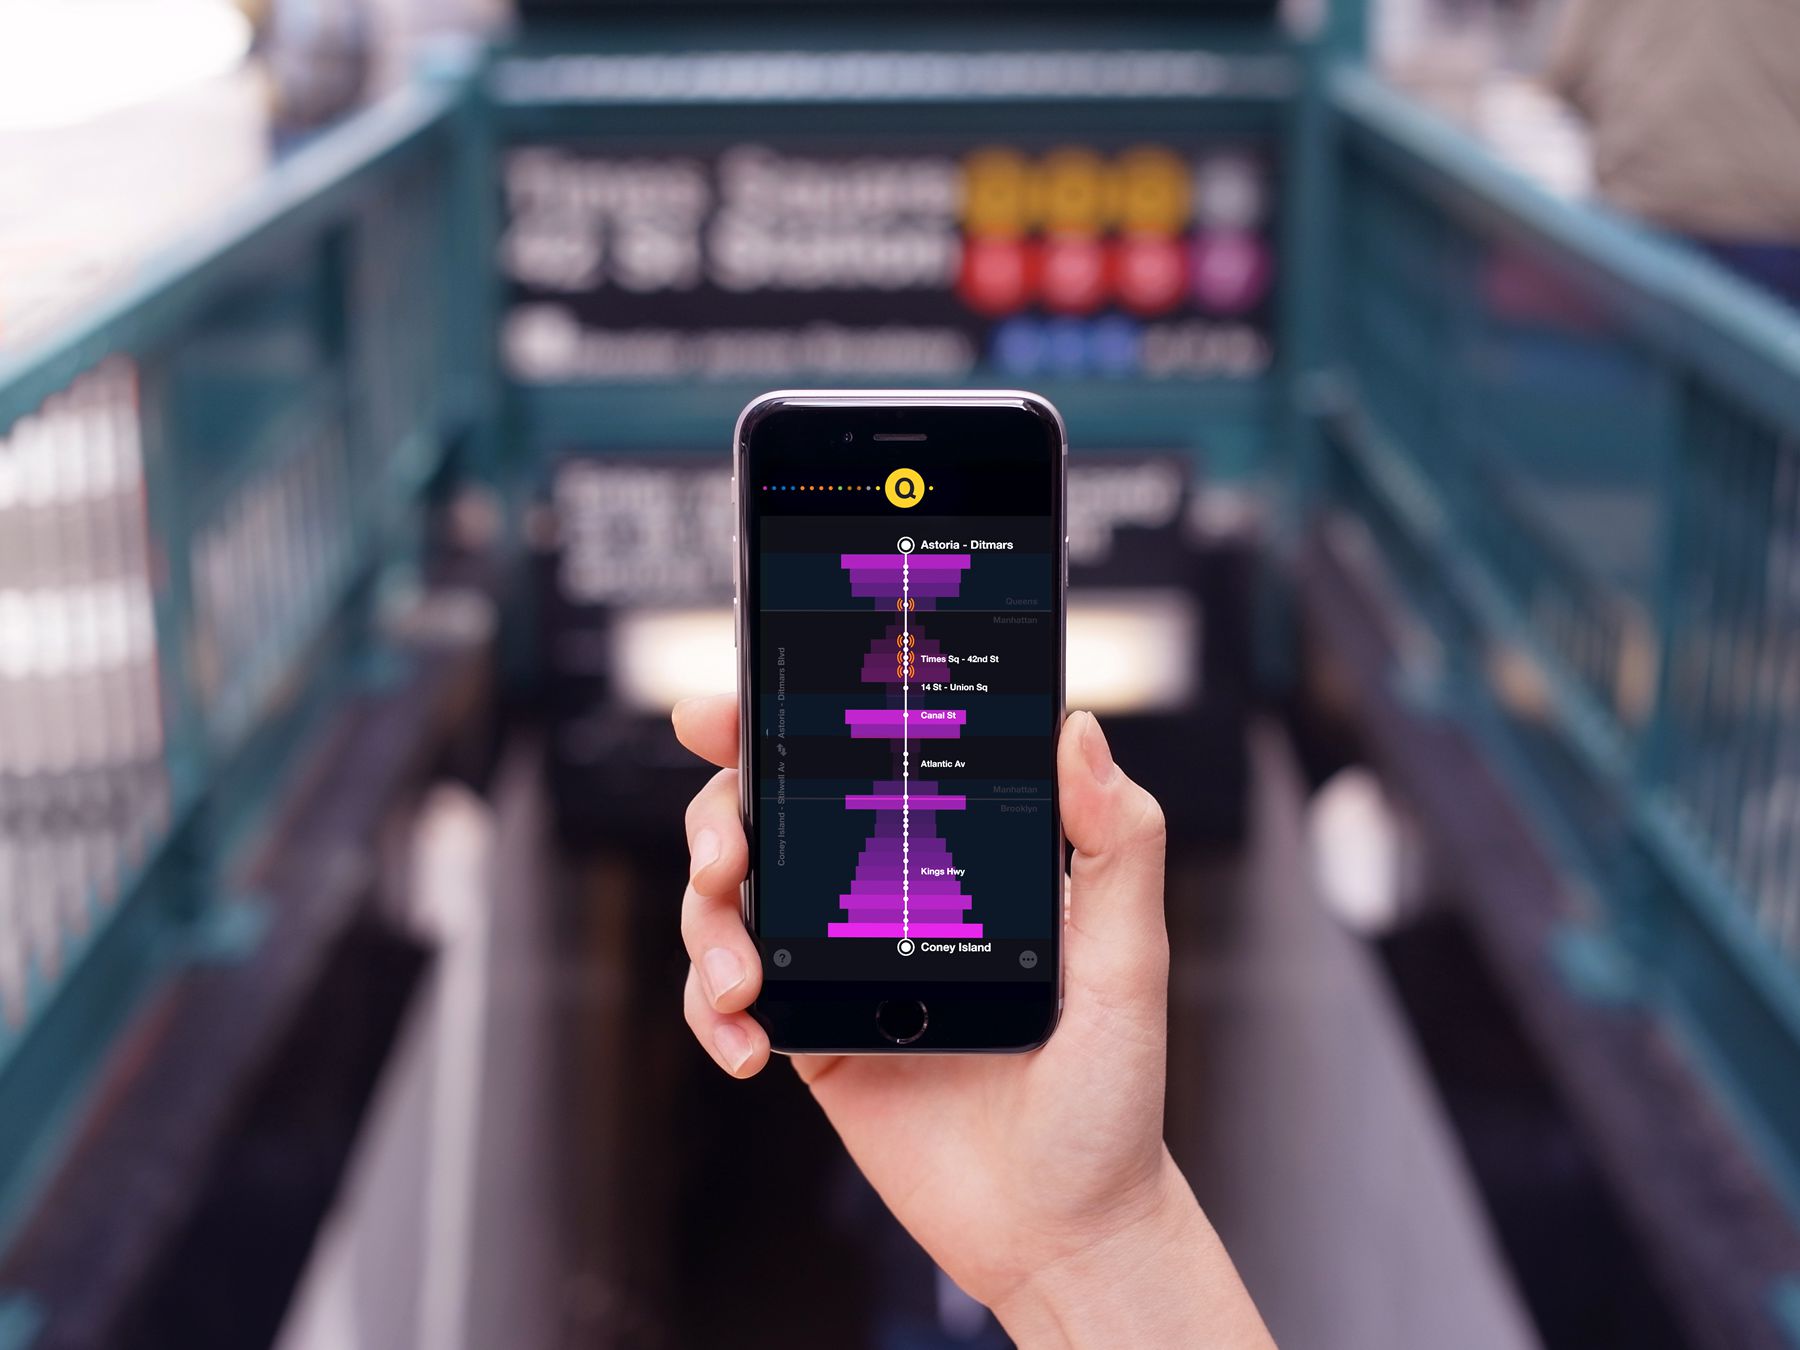
The Subspotting iPhone app - find out where your network is
The app lets you browse through the New York subway lines and see for each carrier how well the network works at a given stop. We also included our overground/underground info (which oftentimes explains the signal quality), plus boroughs and TransitWireless Wi-Fi signals.
I built the app using web techniques and Apache Cordova to turn it into something that we could submit to the App Store. You can buy it there for 99 cents.
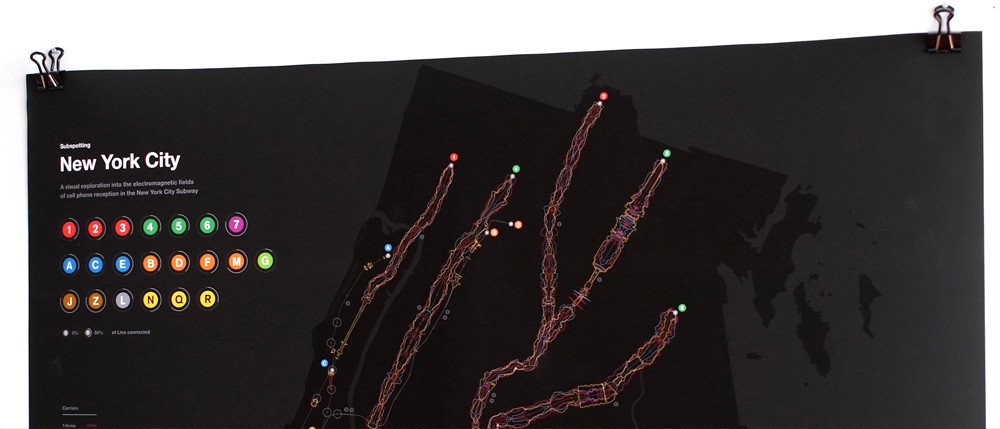
Our second outcome are two posters, which you can buy on our website (support struggling artists ☺).
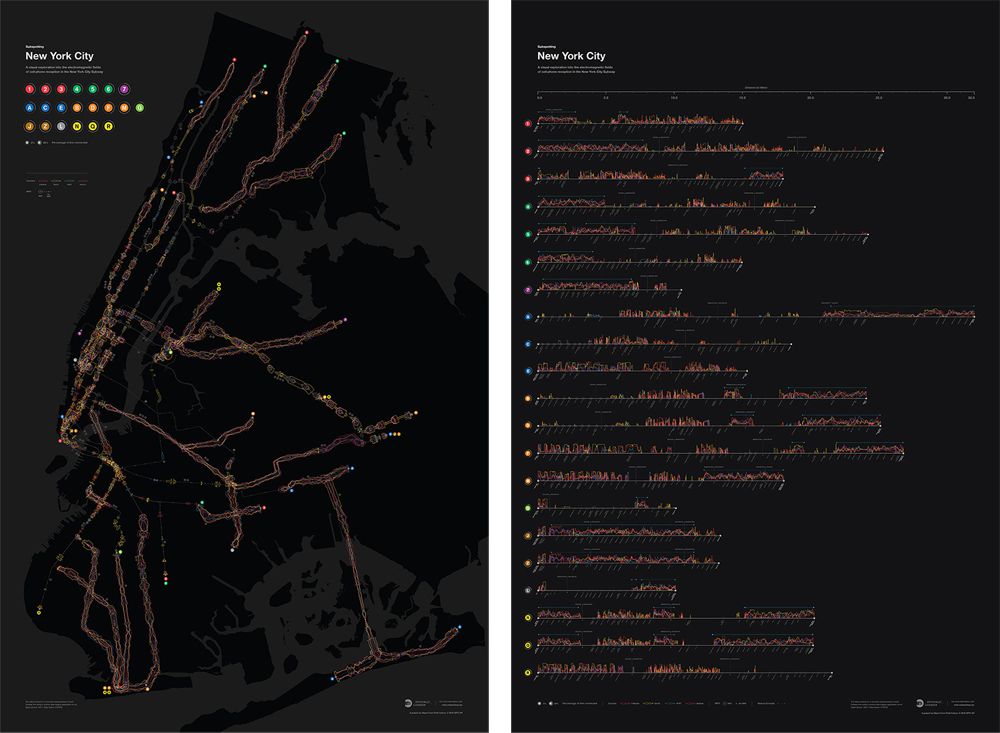
Two Subspotting posters - yours for the low, low price of $40 each
You can find way more information about this project plus interactive visualizations of the data on our project website.
Subspotting was a great project to go through the whole process from data collection to data visualization. We're currently thinking about expanding it to other cities, releasing it for Android and doing more artistic things with the data - stay tuned.