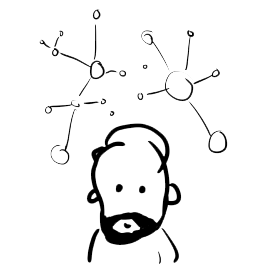
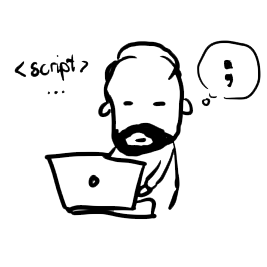
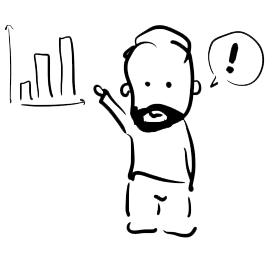
I develop and design
data visualization projects.
And speak and write.
Say hi!
High-performance, bespoke, web-based visualizations.
Online, as installations or apps.
And offbeat experiments.
Work with me
You can hire me for long- and short-term projects. Here’s what I’m good at:

Data Visualization
You have data (good!). But what now?
Maybe you want a beautiful, dynamic & interactive website?
Turn the data into a dashboard or an app for internal use? An installation for the lobby?
Or you just need someone to point your team in the right direction?
I can help with all things data, from processing to design to implementation.

Web Development
You need a capable and experienced web developer? Having spent the last couple of years building for the web, I think I’ve got it now. Let me know when you need someone for high performance graphics or creating unconventional web experiments.

Training
Your team lacks visualization experience? You want to get in on the latest super-hot data thing?
I offer intro- and in-depth workshops on data visualizations, how to design and how to build those things (hint: d3.js).
Let’s talk about what you need!
Writing
I write about the theory and practice of visualizing data here and on Medium.
Using Augmented Reality for data visualization opens up completely new possibilities: visualizations can become part of the environment and enable us to see our world (and our data) like never before.
Can Augmented Reality solve Mobile Visualization?
Mobile displays are necessarily small to be portable, but this makes doing data visualization on them hard. Can Augmented Reality solve this dilemma?
Static visualizations do not exist
If you read a visualization it’s no longer static. It can’t be. Just like words, reading always happens in time. We can’t have it any other way. We as humans are temporal beings, one moment after the other until the last. While going through time, our mind cha...
About me
I'm Dr. Dominikus Baur, an award-winning data visualization designer and developer. I create usable, aesthetic and responsive visualizations for computers & phones, as websites, installations and apps. My scientific background lets me squeeze the optimum out of theory and practice.
Part of my training was doing a PhD in Media Informatics at the University of Munich (LMU).
Back then (2007-2011), my research focused on making our growing personal databases of media,
status updates and messages manageable by everyone.
Such personal visualizations have to work across devices and be as appealing and easy-to-use as possible.
UX, usability and interaction design were therefore already an integral part of my work.
After continuing my research as a visiting researcher at Columbia University and later as a postdoctoral fellow at the
University of Calgary, I decided to leave academia.
As a freelancer, I was very fortunate to work with highly gifted practitioners. Together, we've created beautiful
visualizations for clients such as the OECD, Google or Microsoft Research.
The focus of my work is on web-based design and development.
When I create data visualizations, I approach it
with the reader in mind - first and foremost. What guides my designs is their tasks, their goals and their
contexts. Every step of the way from raw data to interactive graphics requires care and patience. But it's absolutely worth it,
when the results are usable, appealing and informative.
Questions? Comments? Let me know!