I've been meaning to write about visits for a while now. I've even been asked if I was involved at all since it didn't show up on my website. So, mea culpa and here we go.
Visits is an on-going research project about visualizing personal location histories. "Personal location history" is a fancy name for having your smartphone track your position on the globe in the background, thus creating a time-based list of the places you've been to. Alice Thudt is the lead designer, bringing the brightest ideas, with me as developer and Sheelagh Carpendale as science advisor.
Location histories really are a scary type of personal data.
Location histories are highly personal and also highly debated: in regular intervals, yet another scandal of mobile server providers selling this data to advertisers or phone makers secretly storing it flares up. Edward Snowden's revelations of the NSA tracking billions of such data points a day show that scenarios such as this little cautionary tale of a Minority Report-esque future could soon become part of our reality.
So I completely understand the outrage: location histories really are a scary type of personal data.
On personal data
On the other hand, I'm also always disappointed when personal data once more becomes the bogeyman. Yes, in the wrong hands this data enables various horror scenarios. But it can also be used for empowering the people who have created this data in the first place - us.
Give people the right tools and personal data suddenly becomes empowering.
Coincidentally, I wrote a whole Ph.D. thesis about enabling people to do something with their data. Admittedly, in this case it was the very tame personal data of Last.fm music listening histories, but the point remains: give people the right tools and personal data suddenly becomes empowering and a wonderful extension to our frail biological memories. You can look up that song stuck in the back of your head whose name you forgot, follow and extrapolate your exercising progress or get recommendations for new places and products (which might be a bit off, sometimes). If you're interested in the implications of this intentional or unintentional "lifelogging", Gordon Bell and Jim Gemmell describe a variety of those in their book "Total Recall"/"Your Life Uploaded".
Mostly, the problem is just an imbalance when it comes to tools. The bad guys can hire whoever they need, but unless you have a background in data science or visualization or are one of the Quantified Self enthusiasts, working with your personal data might not come naturally. Visits is a continuation of the effort I started with my Ph.D. work to give people their data back by giving them the right tools for the job.
Pins-on-a-map
Collecting your location history can be entirely controlled by yourself: services such as Moves, Google's Location History or the now seemingly defunct OpenPaths run as smartphone apps in the background and keep track of every place you've been to. The result is a combination of places and timestamps.
When it comes to visualizing this data the straightforward approach is "pins-on-a-map": Every place becomes a pin and they're all put on a map. Basically turning the data into a network: each place is a node and each transfer between places an edge. Which, little surprisingly, is a great way to produce marvellous hairballs:
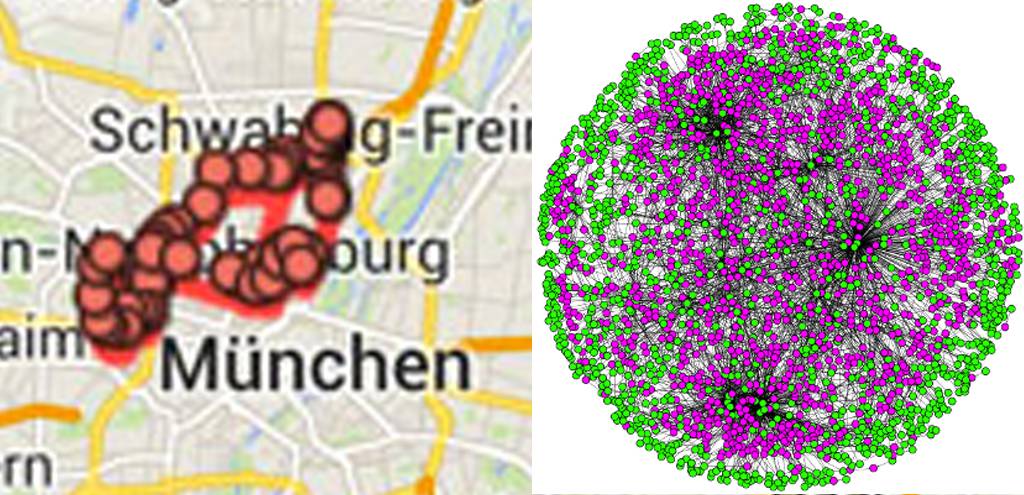
Separated at birth? Location histories as pins-on-a-map and good old network hairballs.
The result might not only be confusing, but important information is lost as well: if you've been to the same place multiple times all corresponsing dots become one blob. Similarly, transits from place to place might overlap as well, creating an indecipherable mesh of edges. In short, pins-on-a-map is a very effective way of burying the temporal aspect of location histories.
Map-timelines
How do you prevent this loss of information in the visualization? Alice's original idea for visits was simple but ingenious: since location histories are combinations of locations and timestamps, why not combine the corresponding visualizations for these data types?
Temporal data is most commonly visualized on a timeline - using one spatial dimension as a stand-in for the time dimension. So, by splitting up the map into smaller segments and arranging them based on time we arrive at a map-timeline:
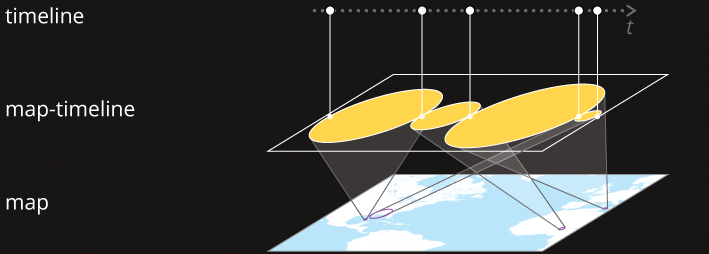
Map-timelines combine maps with timelines - the longer the stay at a place, the bigger the corresponding map bubble.
Each stay at a place get its own map bubble, still showing locations as pins but with much less overlap. Coming to the same place repeatedly creates multiple bubbles. Transits between places, which are usually not very interesting, are downplayed - they're the places where two maps touch. The sequence of stays can be conveniently read from left to right. And finally, since longer stays also means larger map bubbles, these important places also get more visual weight.
Visits
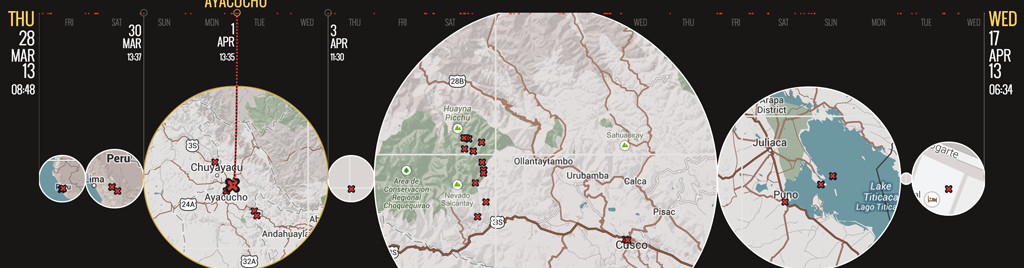
Visits is a web-based tool that takes location histories and turns them into interactive map-timelines. Visits works with OpenPaths or Google location histories and can even use geo-tagged Flickr collections as input. And finally, due to a weekend spent coding a month ago, visits now also works with data from Moves which is probably the most convenient way to collect your location history.
Visits automatically turns the data into a map-timeline and makes some assumptions about it: one important aspect is what defines a place. Since each place gets their own map, a sensible setting must take the type of location history into account. Working with two-weeks of vacation data? The hotel and the beach should probably count as distinct places. Working with a five-year lifelog? Having countries as places should lead to better results. The trade-off is always been creating too many and not enough map bubbles. Fortunately, visits lets you adjust that setting interactively - just drag the 'Place Size' slider at the bottom et voilà:
What makes a place? The same location history with different distance settings for places.
Visits can also import photos from Flickr. They either work as self-contained location histories (if each photo has GPS- and timestamps) or enrich an existing location history. Photos are shown as little red crosses on the map and can be enlarged by hovering over them.
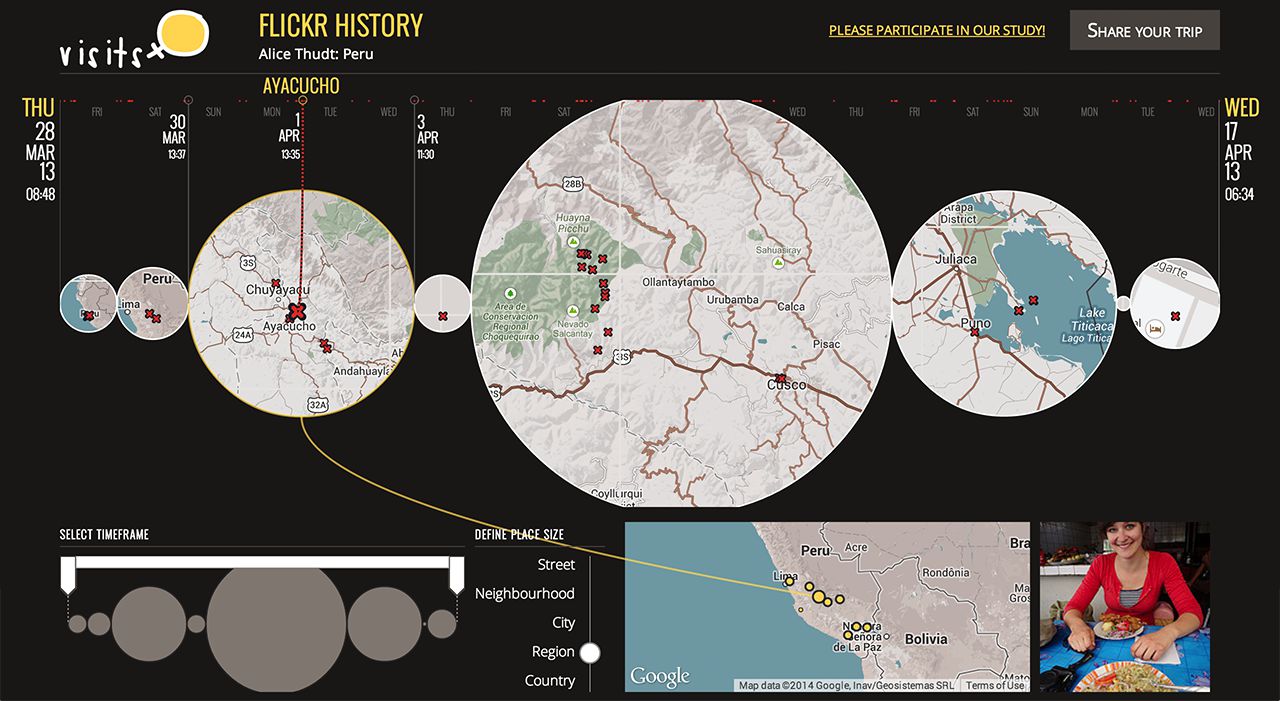
Visits working with both a location- and a photo history.
Sharing and privacy
One important aspect for visits was privacy: due to the bum rap of location data (see above) we wanted to make sure that people felt comfortable giving their data to the tool. Therefore, all data processing and visualization happens in the frontend and no data is uploaded to our server. Unless, that is, when somebody creates an instant visit.
Our vision for visits was that it should work like a photo album.
Our vision for visits was that it should work like a photo album: something that you could use to re-live certain moments of your life such as a memorable vacation or your year abroad. And just like a photo album, sharing these moments with other people is an important part of reminiscing.
Therefore, visits also supports sharing the current location history by clicking the 'Sharing' button in the top right. This opens a dialog that lets you fine control how much you're willing to share - you can cut off the data detail based on the place settings. So, choosing 'City', for example, would only share the cities you've been to but not the exact addresses you visited there. In the end, the relevant, filtered data (we never get the full dataset unless people explicitly want to share that) is uploaded to our server and we store it as an instant visit. Each instant visit gets their own randomly generated cryptic URL (like this one: http://v.isits.in/stant_e40NrZOE8) which is only shown once. Opening the instant visit URL opens the visits-interface with the relevant data insta-loaded.
Technology
When looking at the visits-code while doing the Moves update a couple of weeks back, I realized how far Javascript and me have come. Visits was one of my first major web-based projects and it shows - the coding style is definitely ... different. On the bright side, it demonstrates what a flexible language Javascript is.
The main visualization is built using Raphaël, a cross-browser vector graphics library which supports SVG and VML (!). Maps are loaded from Google Maps and turned into circles by drawing a mask over them. Raphaël was also ahead of its time when it came to animations - flying map bubbles and other details were straightforward to implement.
On the backend of things, visits is running on a Heroku instance with a little node-script taking care of serving the page and storing instant visits in a MongoDB database.
Reception
Visits was well-received and we had some media coverage from places like FastCo.Design (Map Your Adventures With This Interactive Travel Visualizer), Infosthetics (Visits: Mapping the Places you Have Visited) and FlowingData (Explore where you’ve been with Visits).
We were especially happy about a mention on freetech4teachers.com (Visits - Create a Flickr & Google Maps Location History Timeline), advocating visits as a tool for education, both for student field trips but also in history class.
One very nice example is this instant visit of Ben Jonson's Walk to Scotland. Ben Jonson was a poet who at some point 400 years ago decided to take a leisurely stroll from London to his ancestral Edinburgh. Given the extensive documentation of Mr. Jonson's trip it could even be recreated in visits (thanks anonymous creator!).
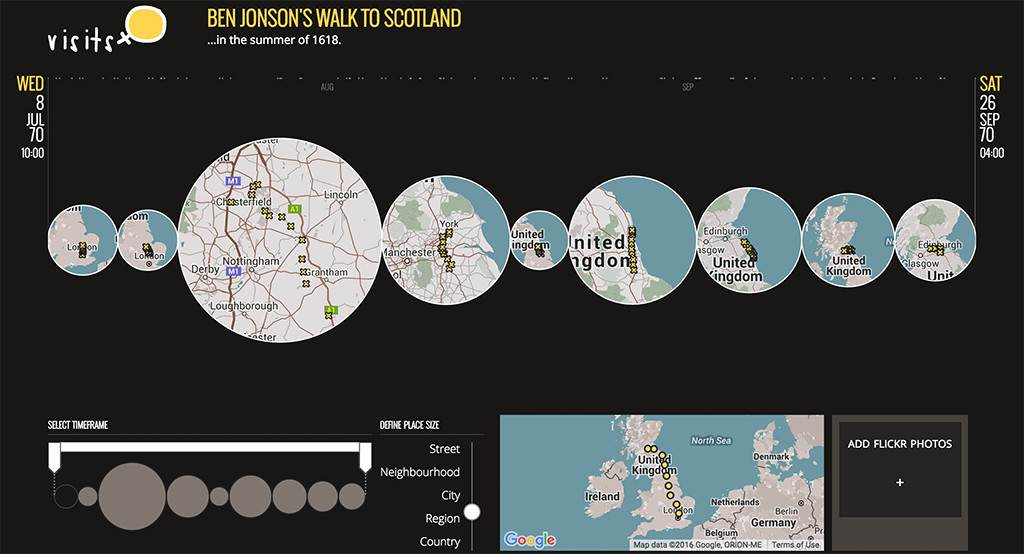
An example of a historical visit: Ben Jonson's walk to Scotland.
So, give visits a try with your own location history, follow the project on twitter for updates and let me know in case things break!