Subspotting


Getting a cell phone signal on the subway can be hard - even in cities like New York.
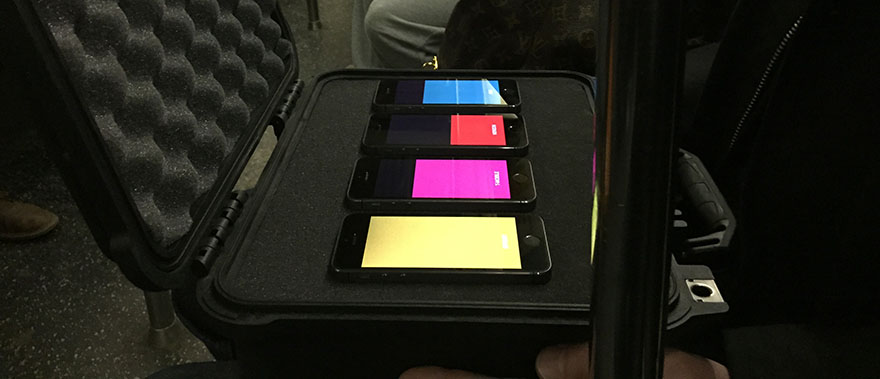
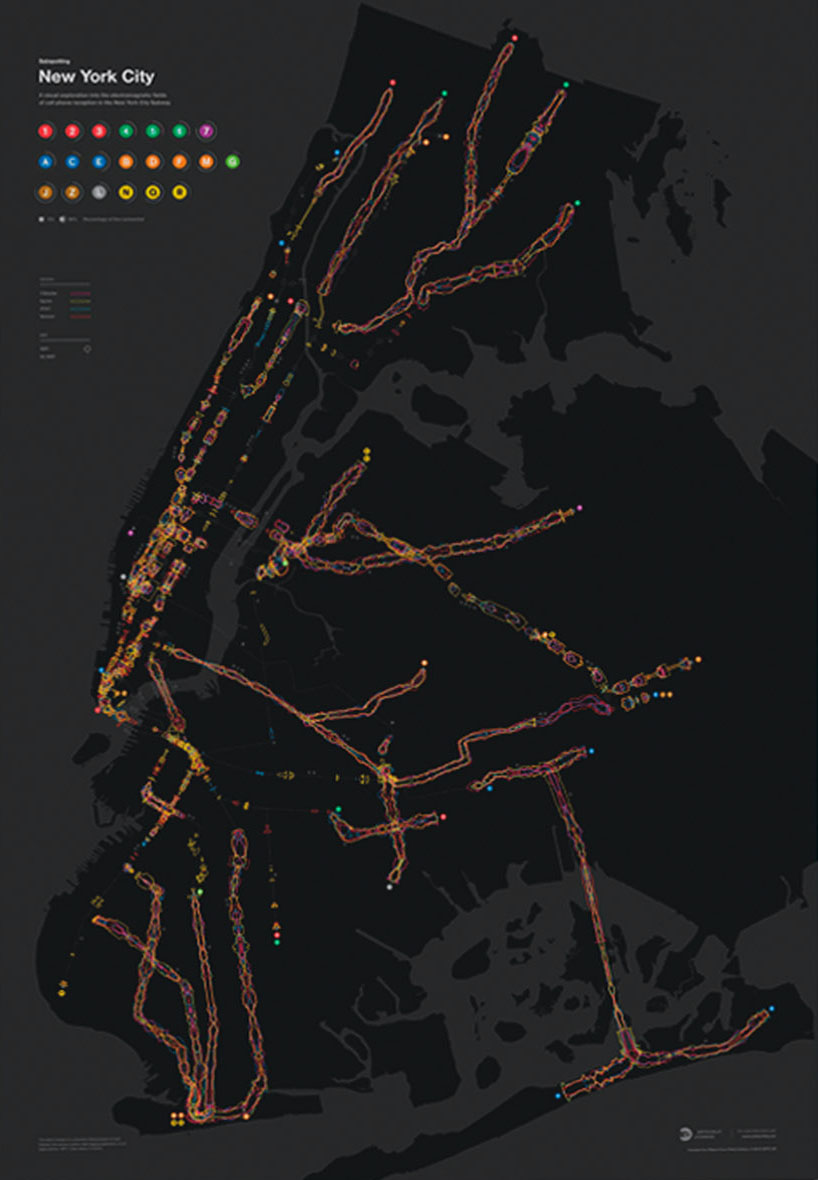
The Subspotting project captured the cell phone reception along the complete NYC subway network for the four main carriers. Using a custom-built measuring app, we traversed the whole 660 miles of track. The resulting unique dataset shows in detail how strong the signal will be at a given point on a given line.
Subspotting makes this dataset usable and available as a low-resolution interactive visualization on the project website and as a free iOS app . Finally, as a more decorative entry, the Subspotting dataset is also available as two beautiful posters.
The project - a collaboration between Daniel Goddemeyer and myself - encompassed the complete data science process from measuring data with a custom tracker, via in-depth data processing and wrangling to creating visualizations and an app.
Awards
FastCompany Innovation By Design 2016 - Honorable Mention
Selected Press
Wired: Super Handy Maps Show Which NYC Subway Lines Get Cell Service, and Where
The Verge: Track cell service along your subway route with this new app
Citylab: A Lovely Map of Phone Reception in the New York Subway
FastCoDesign: Where To Find Cell Reception On The Subway (It Does Exist!)
Tech
iOS
Objective-C
Cordova
d3.js