Data Futures


Data Futures is a live experiment about the connections between our data and ourselves. It is run in conference settings, with a large, real-time visualization on a projector, two moderators (Daniel and me) and the participants' smartphones. The latest presentation was at TEDx Louvain (see video).
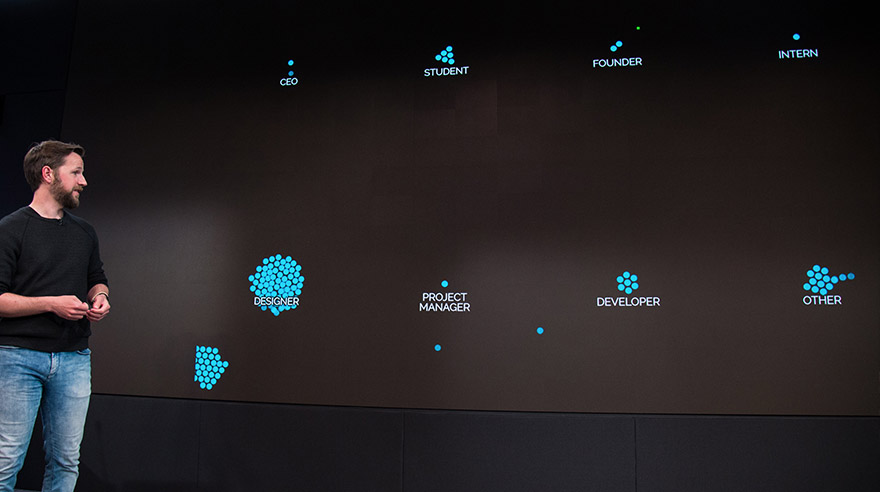
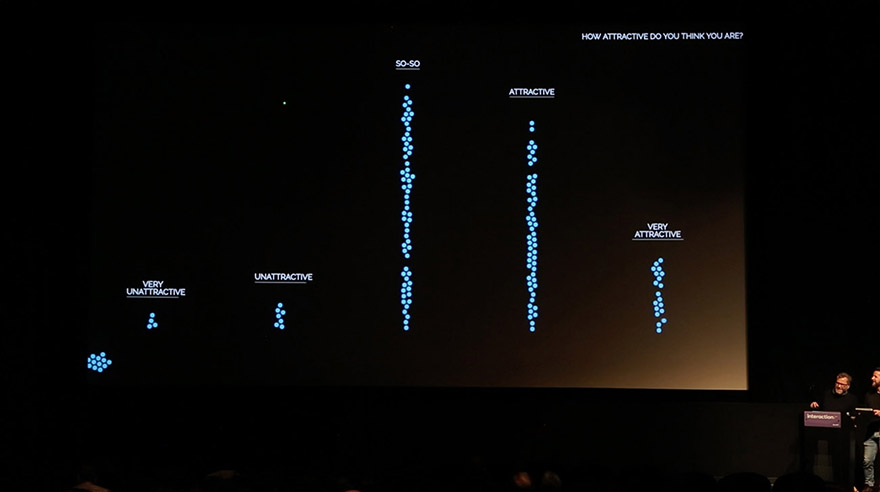
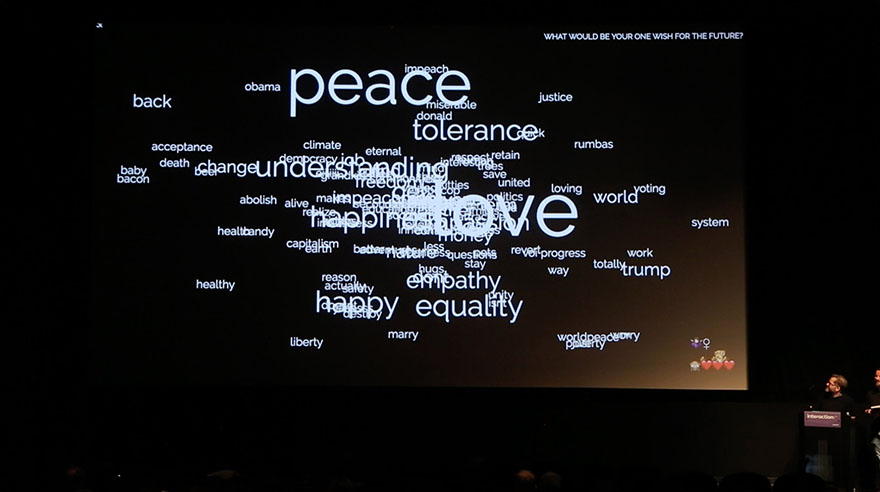
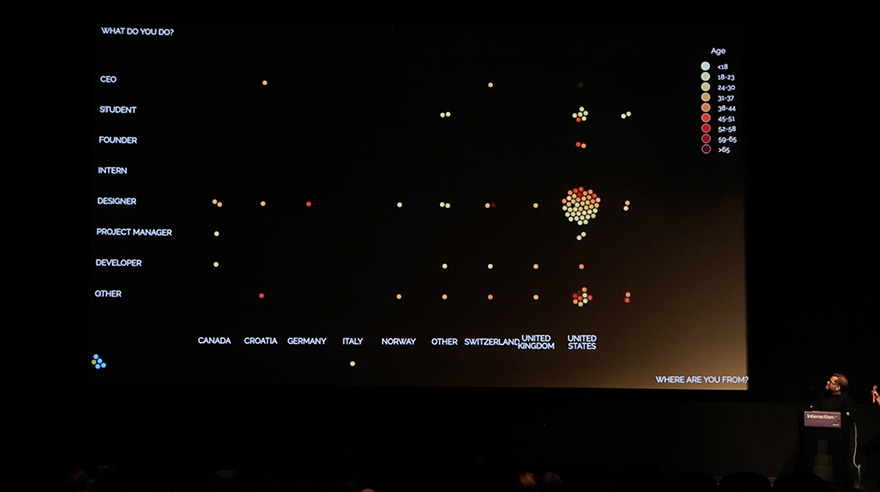
The audience is guided by their friendly hosts through a series of questions, some innocuous, some less so. Answers are visualized live on the big screen and in real time. As the questions progress, everyone understands more about the people around them - while at the same time being put more into the spotlight as well.
Data Futures uses a socket.io-based backend that supports hundreds of participants' phones and tablets. After opening a URL in their browsers, people are guided through multiple-choice questions. Every participant is directly represented as an (anonymous) small bubble in the live visualization that jumps to their selected option. Participants can still change their answers until the hosts progress to the next question (sometimes leading to people frantically changing their answers just to see the bubbles jump around in the visualization).
Without wanting to spoil too much: In the end, the seemingly unidirectional channel from phones to the projection becomes increasingly symmetrical...
If you want to have Data Futures at your conference or other event, send me an email!
Awards

Tech
d3.js
socket.io (communication)
node.js
express
sqlite
AWS
mobx
React