On Broadway


On Broadway presents a data-driven portrait of a city.
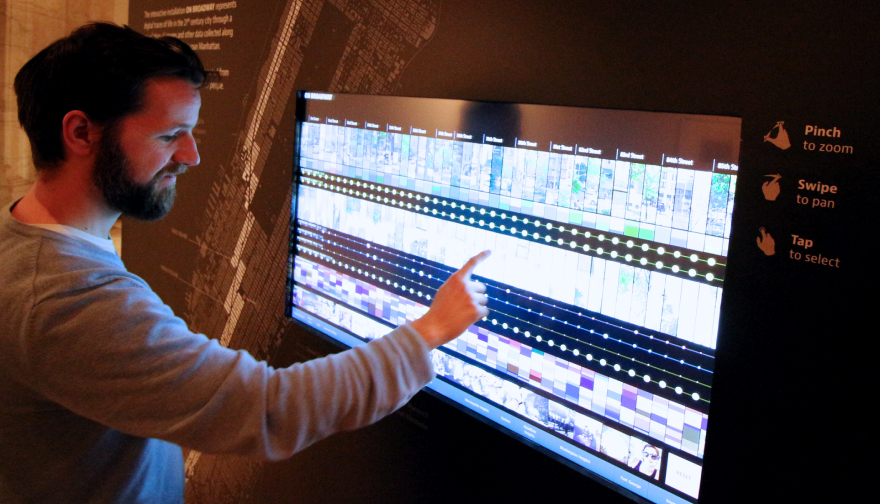
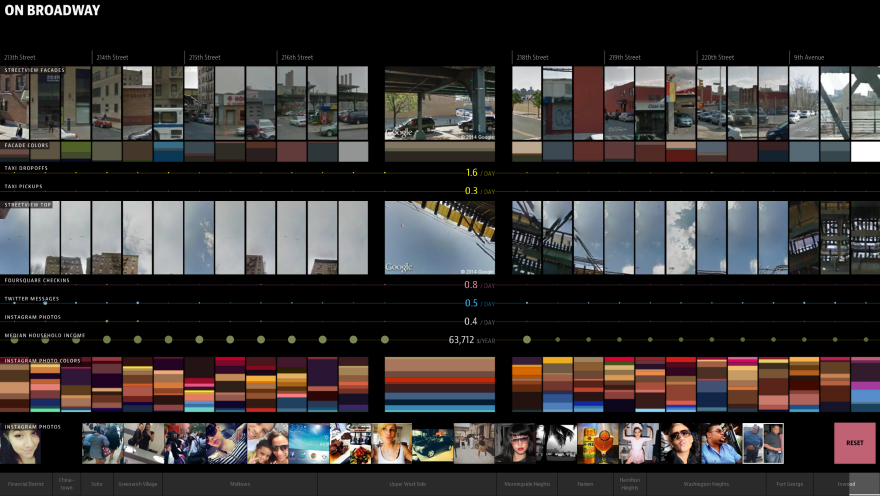
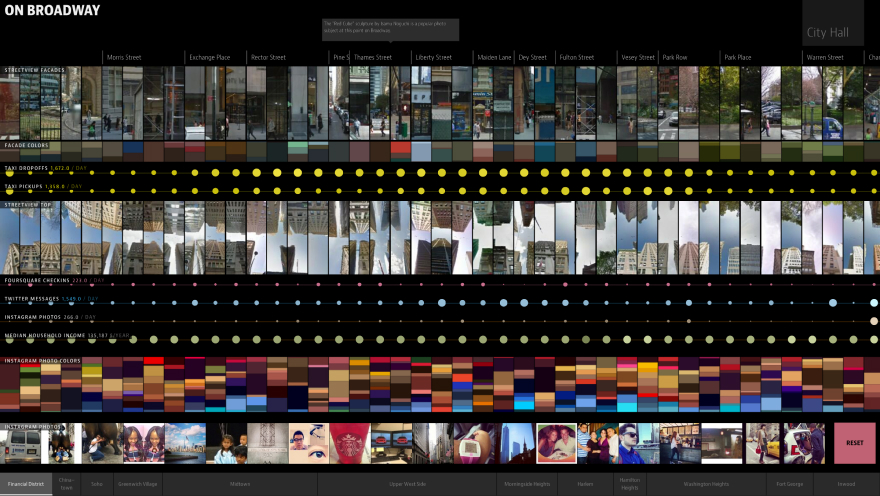
Initially conceived for the Public Eye exhibition at the New York Public Library, On Broadway is a visualization-heavy installation for touchscreens that shows NYC's most iconic street through the eyes of data.
Starting from an overview of the whole thirteen miles of Broadway, the project draws from various data sources ranging from public data like household incomes, via social media to Google Streetview pictures. With the Broadway as the central navigation metaphor, readers can explore these diverse datasets and see the city in a new way.
Since its inaugural presentation at the Public Library, On Broadway has been shown in various group exhibitions across the world, from Shanghai, to Riga, to Amsterdam (see Lev Manovich's website for a full list).
The full application is also available online (heads up: long loading time)!
Read more about the project in this blog post.
Awards
KANTAR Information Is Beautiful Awards 2015 - Silver
Selected Press
CBS News: From sepia to "selfies": 175 years of photography
FastCoDesign: Massive Data Visualization Brings New York City's Busiest Street to Life
Creator's Project: 'On Broadway' Is a Stunning, Data-Driven Portrait of Life in New York City
The Atlantic (Citylab): A Digital Collage of Broadway Made From Strips of Data
Tech
d3.js
hammer.js